Digital twin of Spoordok, Leeuwarden
A 3D planning tool for a real Leeuwarden district, with a local vision model that scores eye-level views, built on my own and chosen by the Municipality of Leeuwarden as the best concept of the student teams.
| Client | Municipality of Leeuwarden, through an NHL Stenden project module |
| Result | chosen as the best concept of the student teams, 16 February 2026 |
| Shown at | NHL Stenden, Leeuwarden city hall, Leeuwarder Digitale Agenda demo day, Rijksontmoetingsplein opening |
| Front end | CesiumJS 1.135 and plain ES modules, on satellite or OpenStreetMap imagery |
| Back end | Flask in front of Ollama, started by one script or Docker Compose |
| AI | a local vision model through Ollama (qwen3.5:9b by default) scores eye-level views and answers questions about the plan |
| Saving | one JSON file per plan, with a versioned schema and migrations |
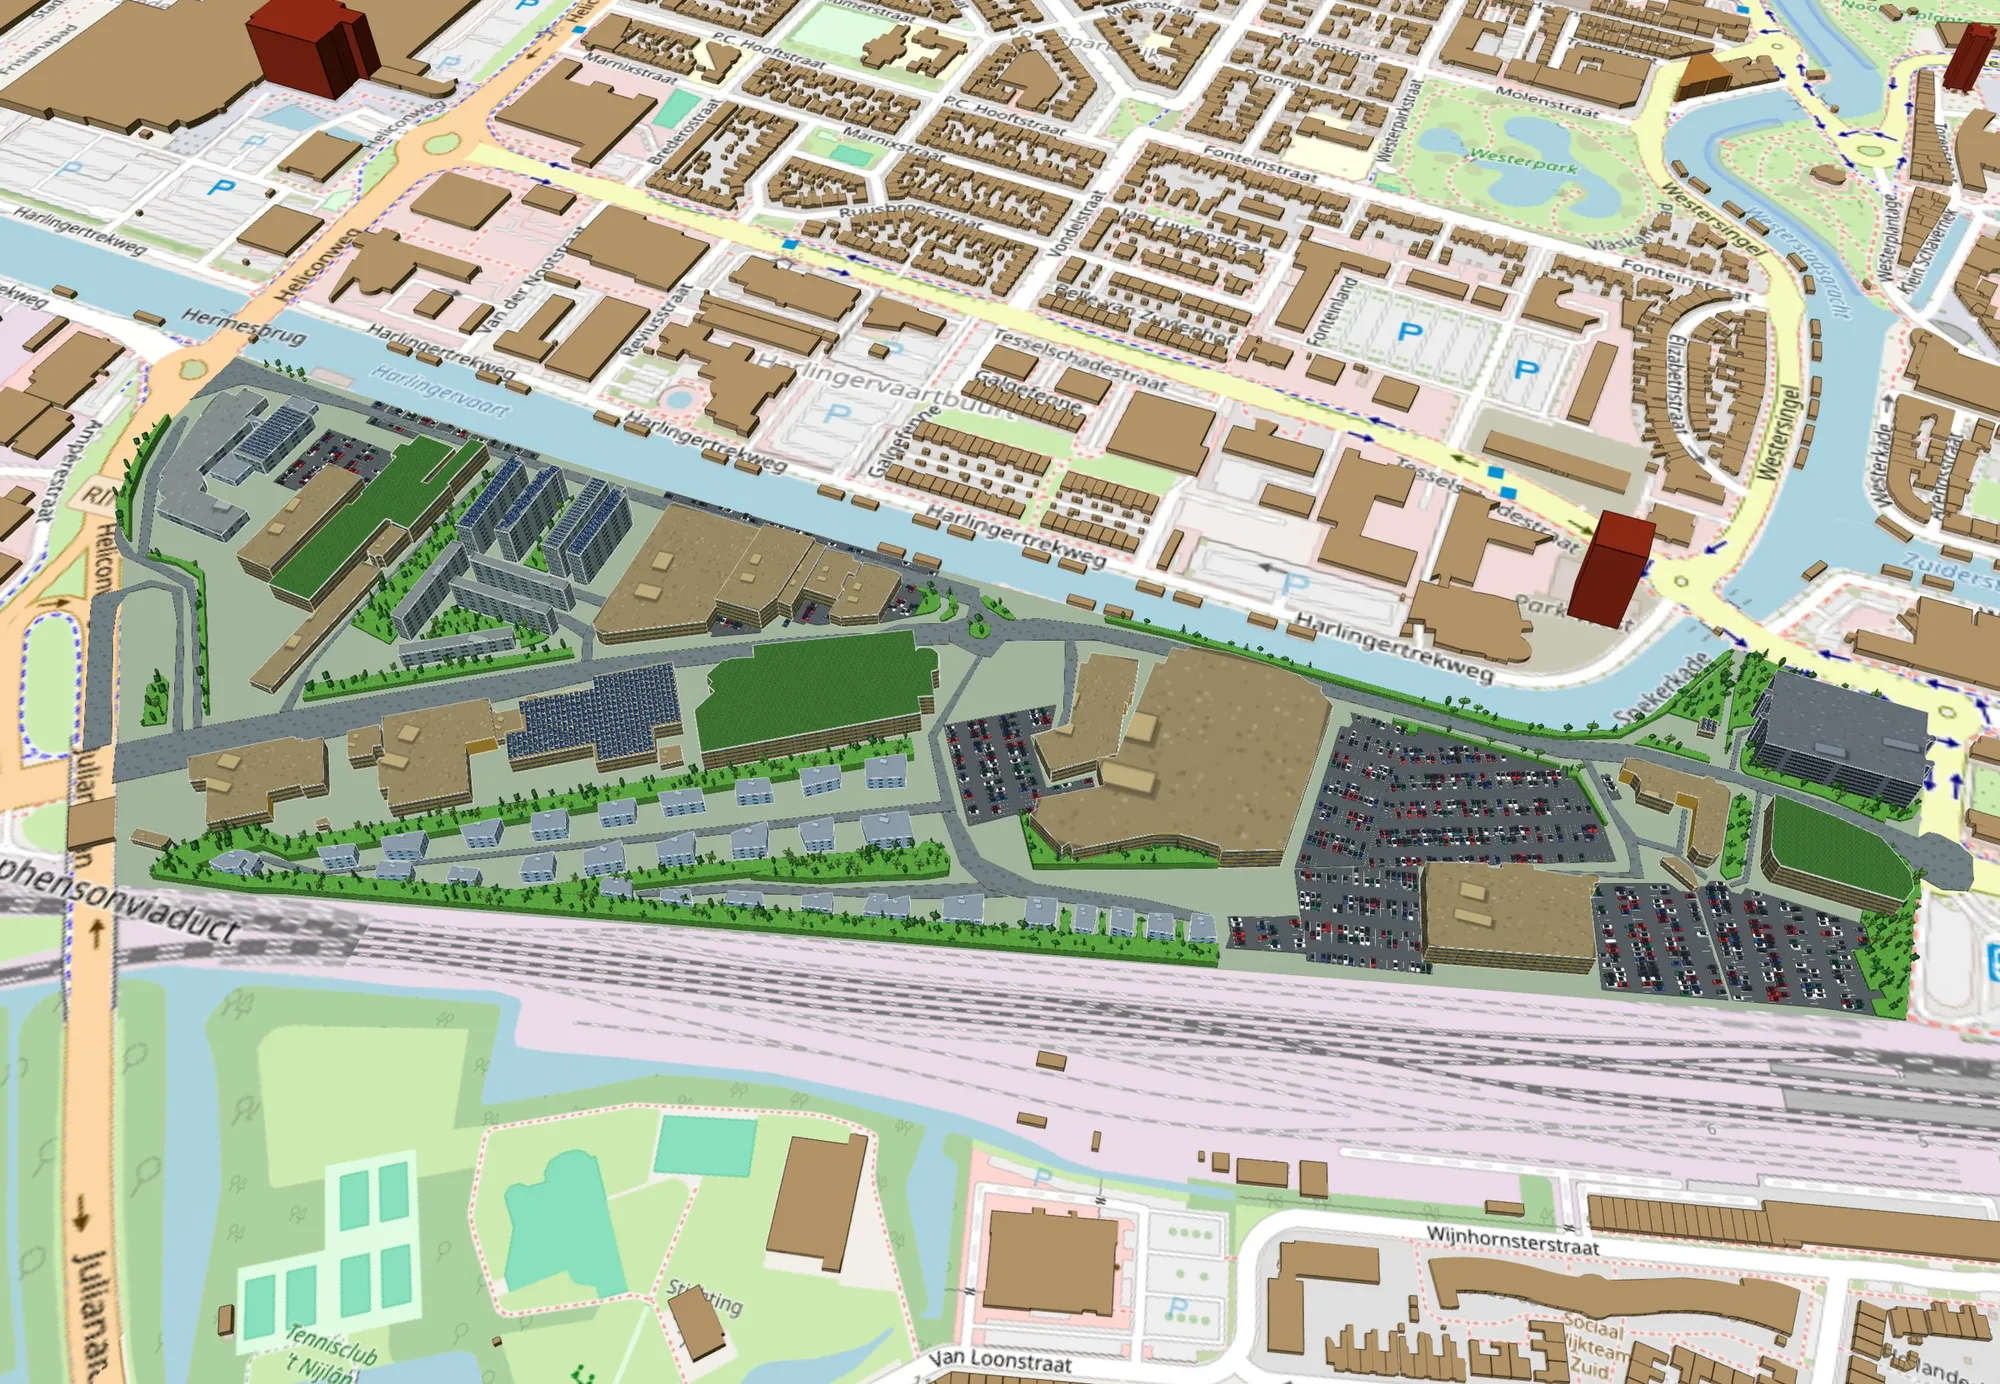
A browser-based 3D planning tool for Spoordok, the strip between the Harlingervaart canal and the railway just west of Leeuwarden station, which the city is redeveloping into a new district. The Municipality of Leeuwarden set the assignment as a competition between student teams of three to five. Mine started as three; the other two left early, so I built my entry on my own, and at the final pitch in Leeuwarden city hall on 16 February 2026 the municipality chose it as the best concept. Buildings, roads, parks and parking are drawn onto the real 21.6-hectare site, and cost, inhabitants, workers, green space and parking are measured against planning targets as each shape is placed. Observers set down inside the plan capture what a person standing there would see, and a vision model running on the same machine scores every view.
The first version, December 2025
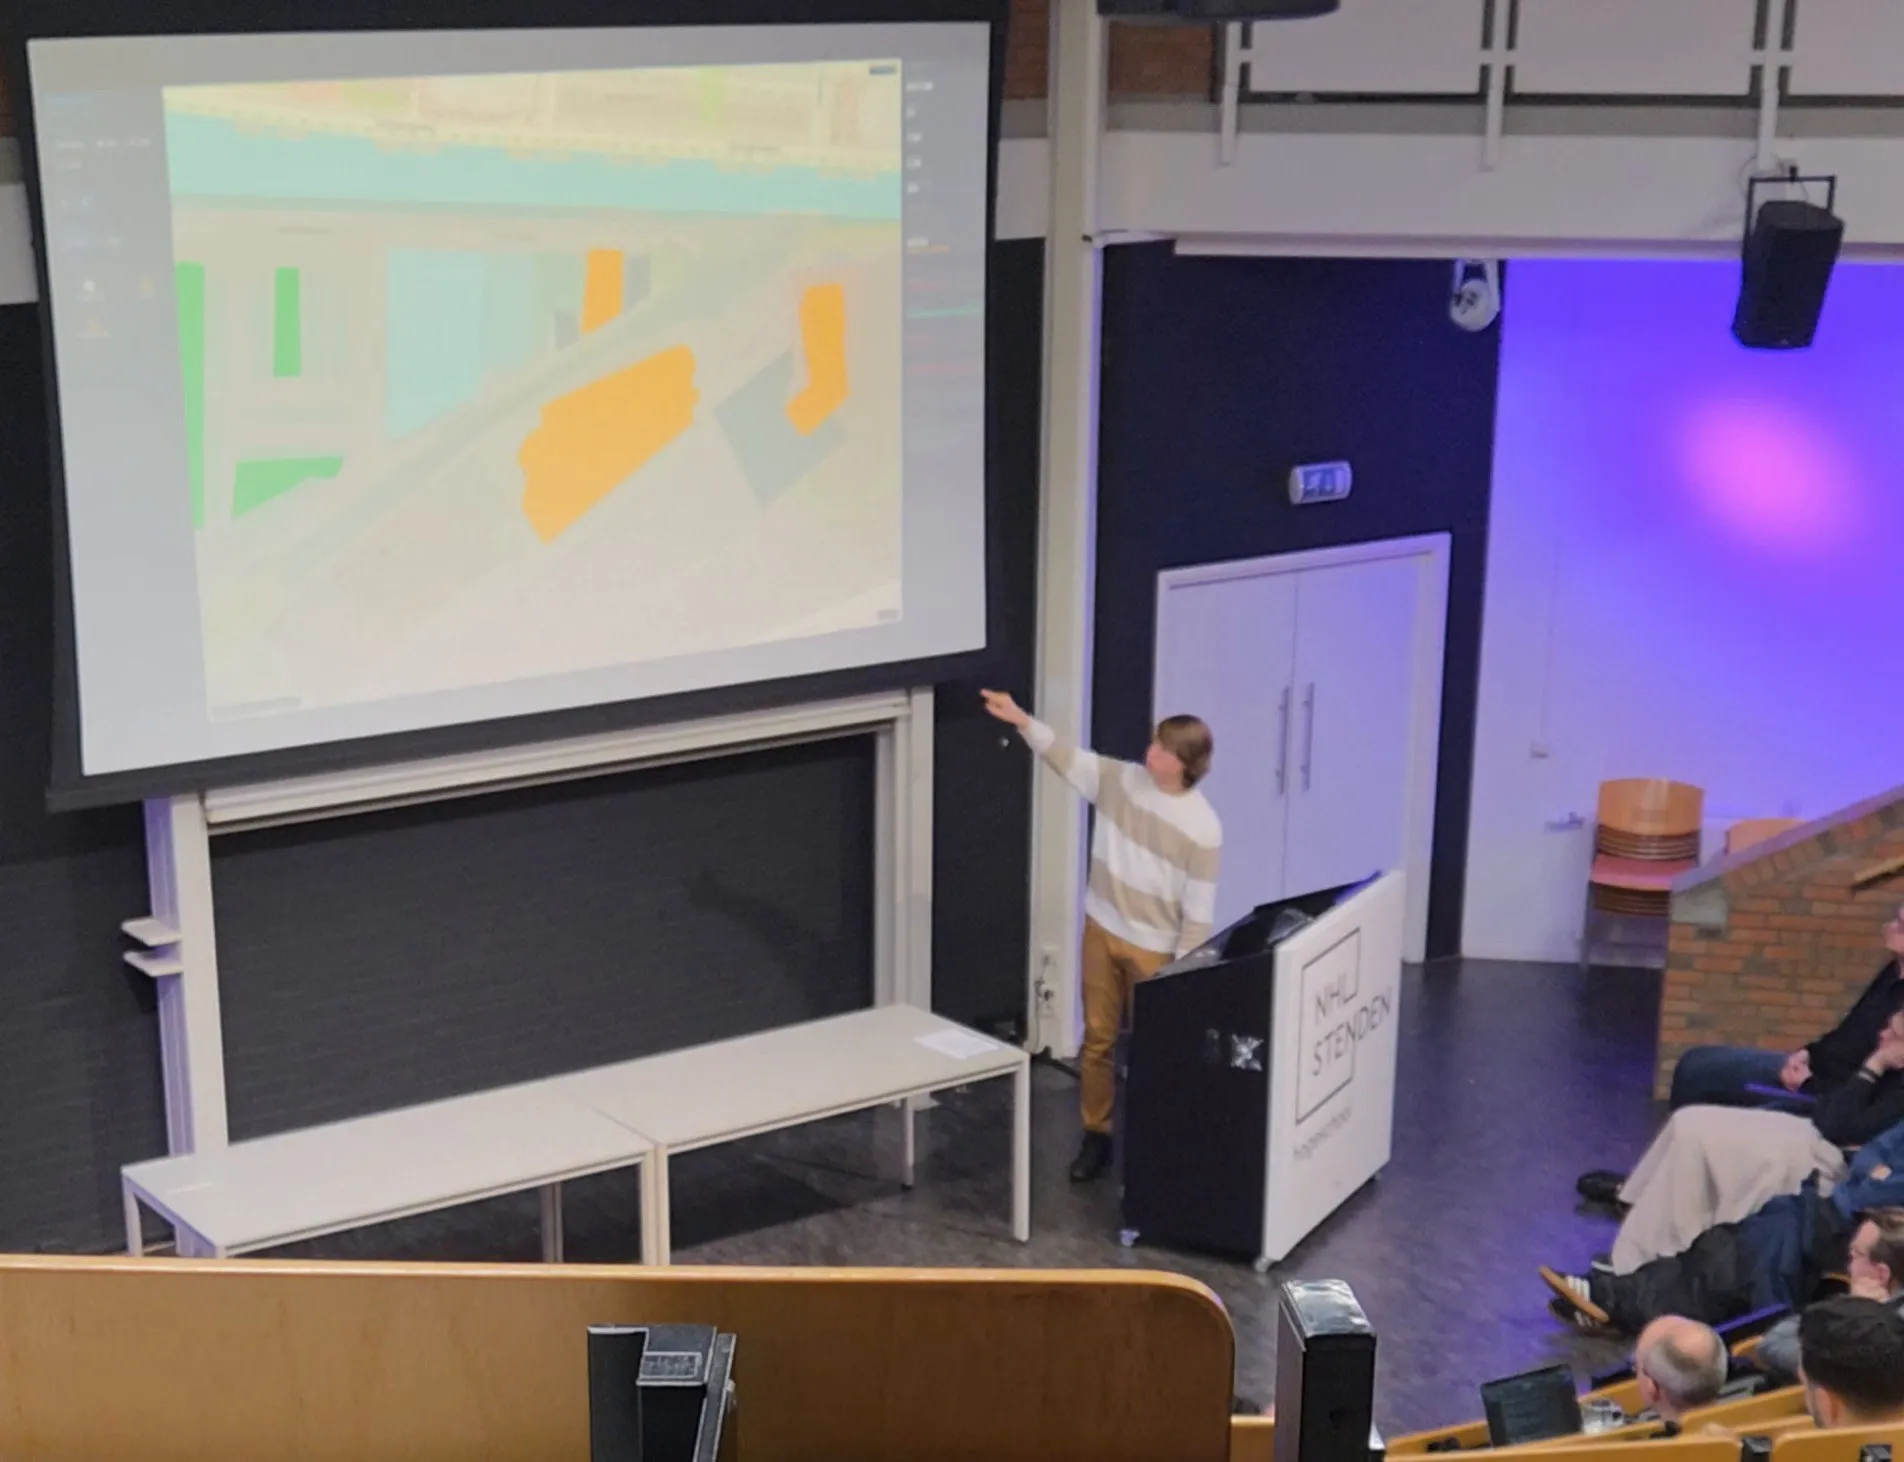
The assignment ran as Project Digital Twin, a second-year module of NHL Stenden’s HBO-ICT programme that I took in my first year. I showed the first working version at NHL Stenden on 18 December 2025. It opened on a setup screen for the goals, the building types and the site boundary, then showed Spoordok on a CesiumJS globe over OpenStreetMap, where footprints were drawn and extruded into buildings. Eight types came with it: detached house, row house, apartment, business building, park, road, surface parking and parking garage. Buildings are costed and occupied per cubic metre of volume; parks, roads and parking per square metre, and the two parking types also yield spaces. A statistics panel measured the plan against the default goals: at least 3,000 inhabitants, 500 workers and 20% green space, business buildings on at most 20% of the drawn area, and 4,500 parking spaces. A whole plan saved to one JSON file. The AI panel was still a placeholder.
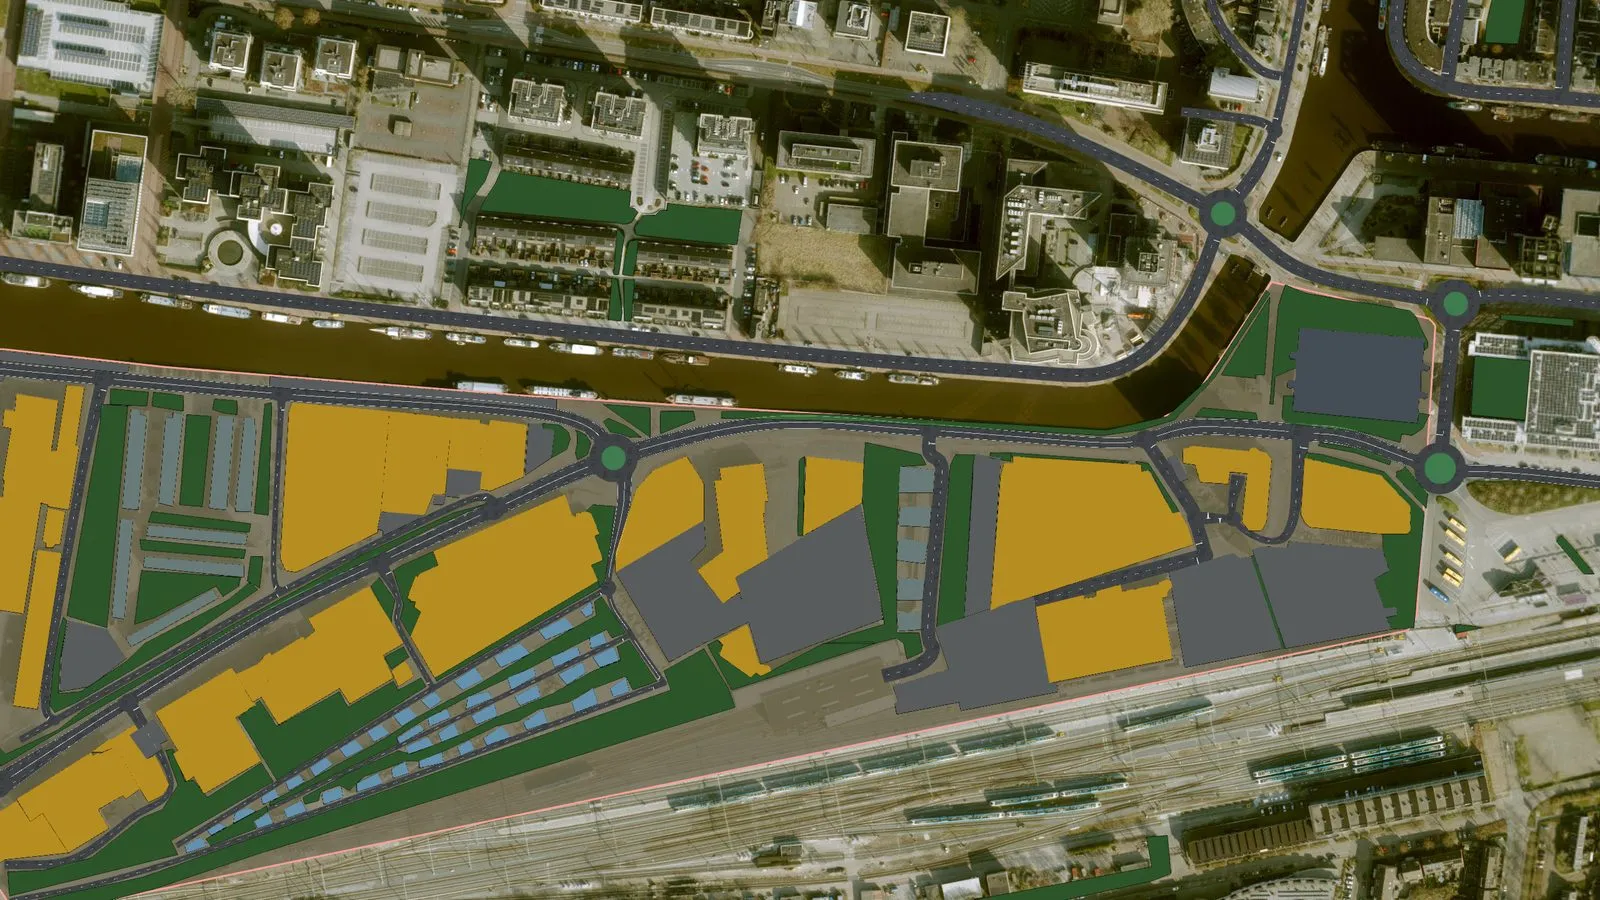
Over the next two days came solar and green roofs, satellite imagery as an alternative to the map, and the existing city around the site as Cesium’s OpenStreetMap 3D buildings, clipped away inside the site boundary so that a plan replaces what stands there today and sits among the real blocks around it.
The evaluation mode and the pitch, February 2026
Cost and occupancy do not say what a street feels like, which is what the evaluation mode is
for. It was built for the pitch: a Flask back end in front of Ollama, and a four-step flow in
which observers are placed, their views are captured and analysed, and the results are read.
In that first version one model (qwen3-vl:8b) described each captured view and a text
model (qwen3:8b) scored the description.
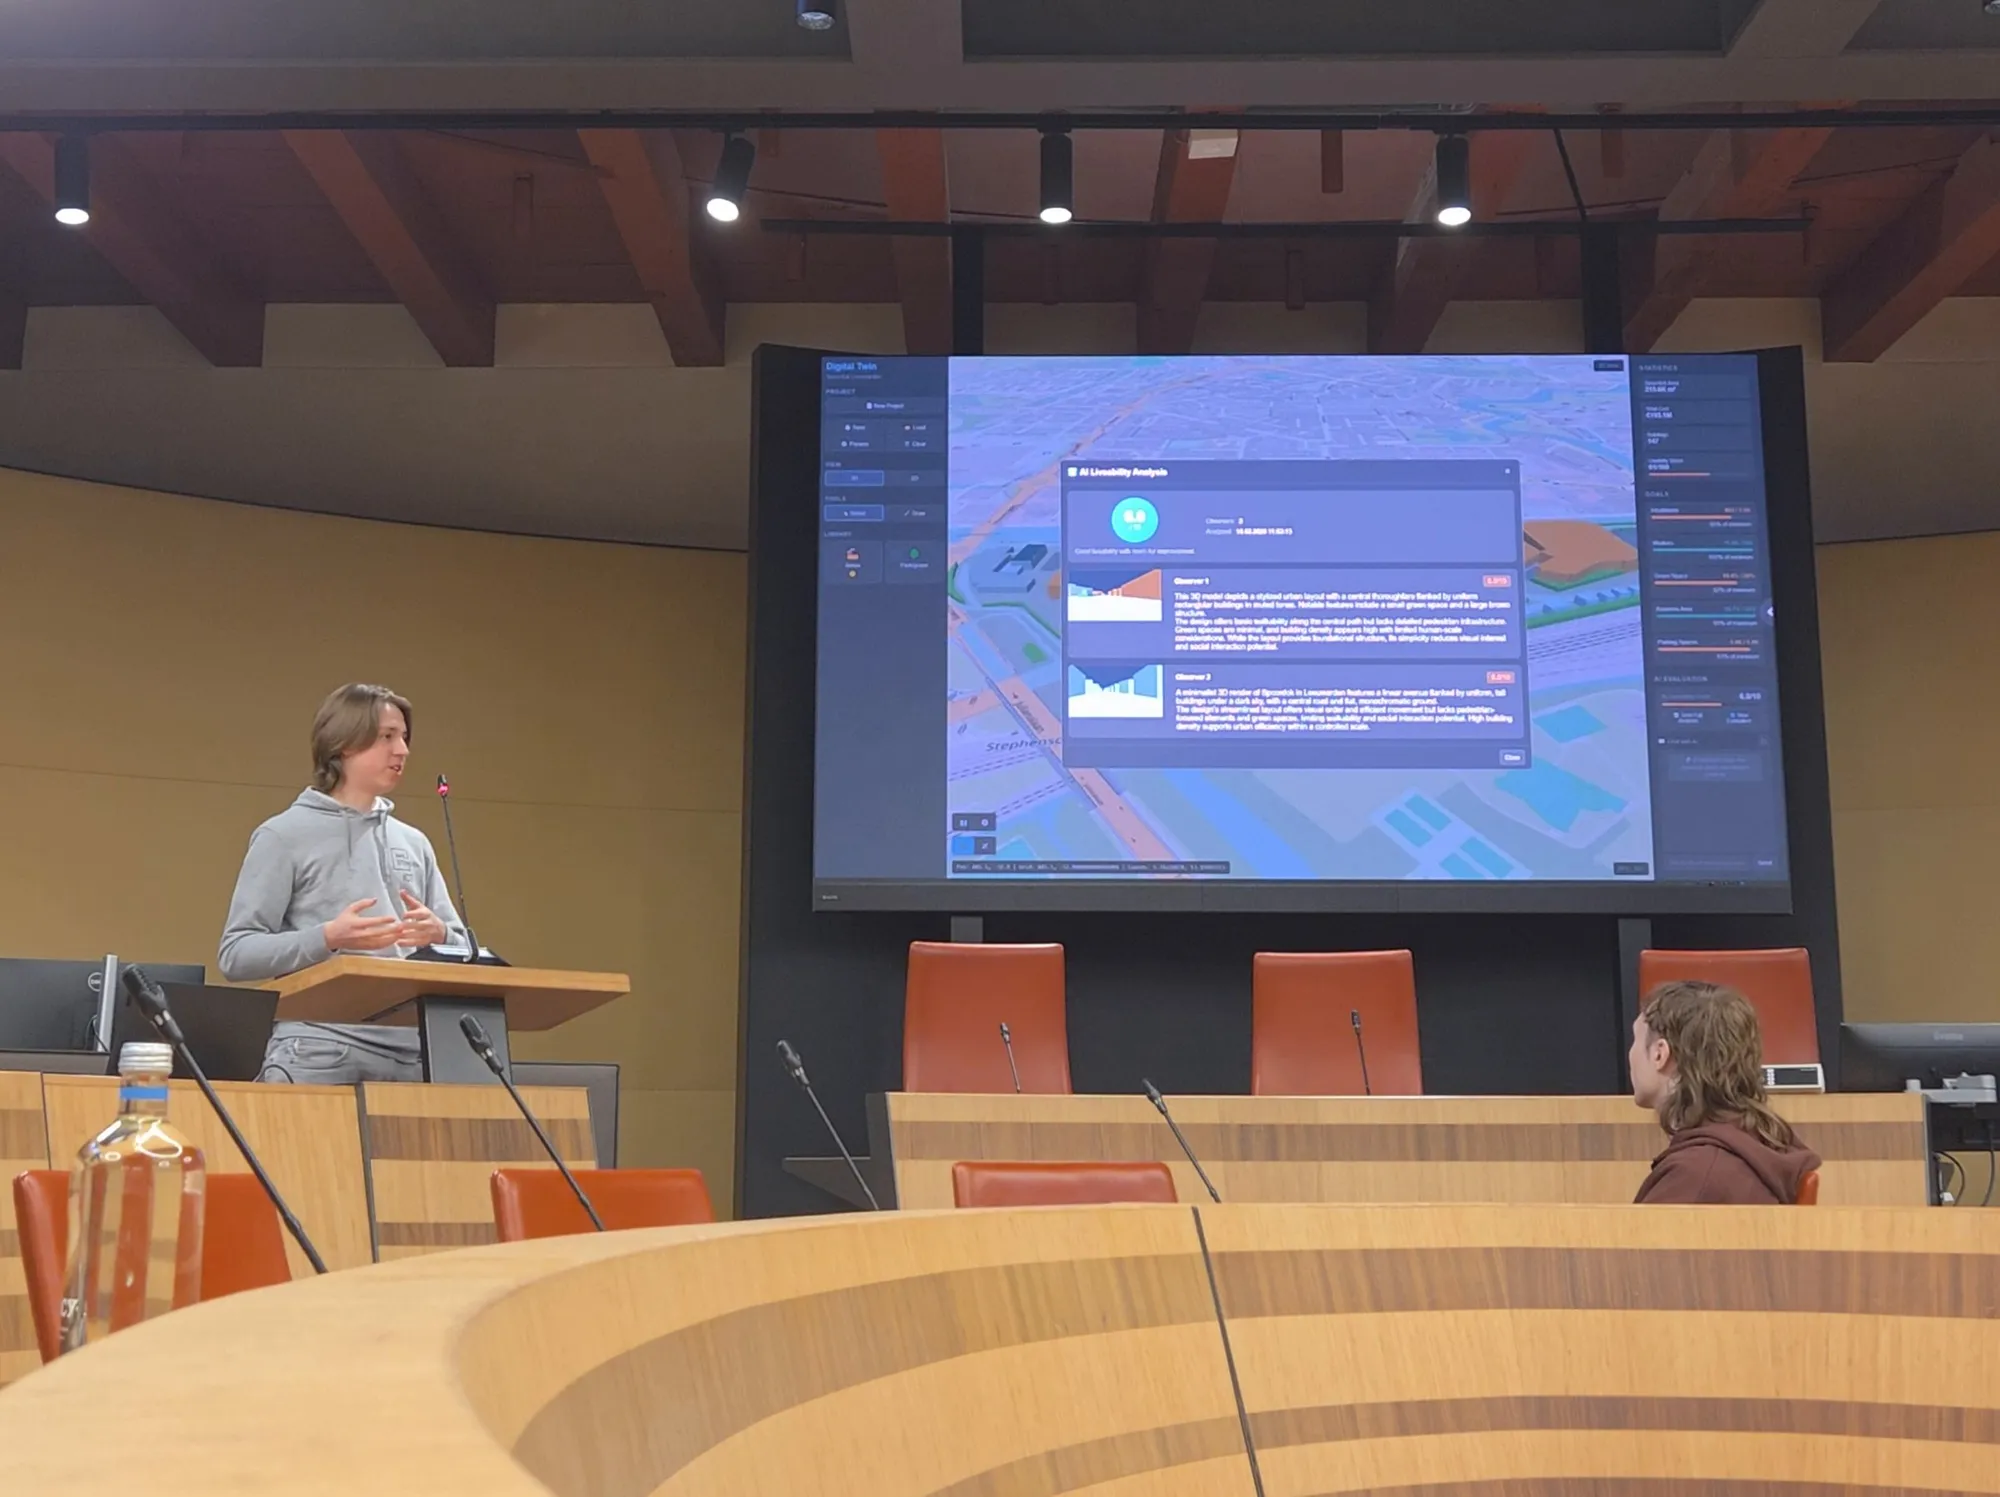
The final pitch was on 16 February 2026 in the council chamber of Leeuwarden city hall, where the student teams presented to the municipality. The municipality chose mine as the best concept and invited me to present it at the Leeuwarder Digitale Agenda demo day. The municipality’s project contacts told me they were impressed by the technical depth of the AI integration and looked forward to working out how to use it in practice.
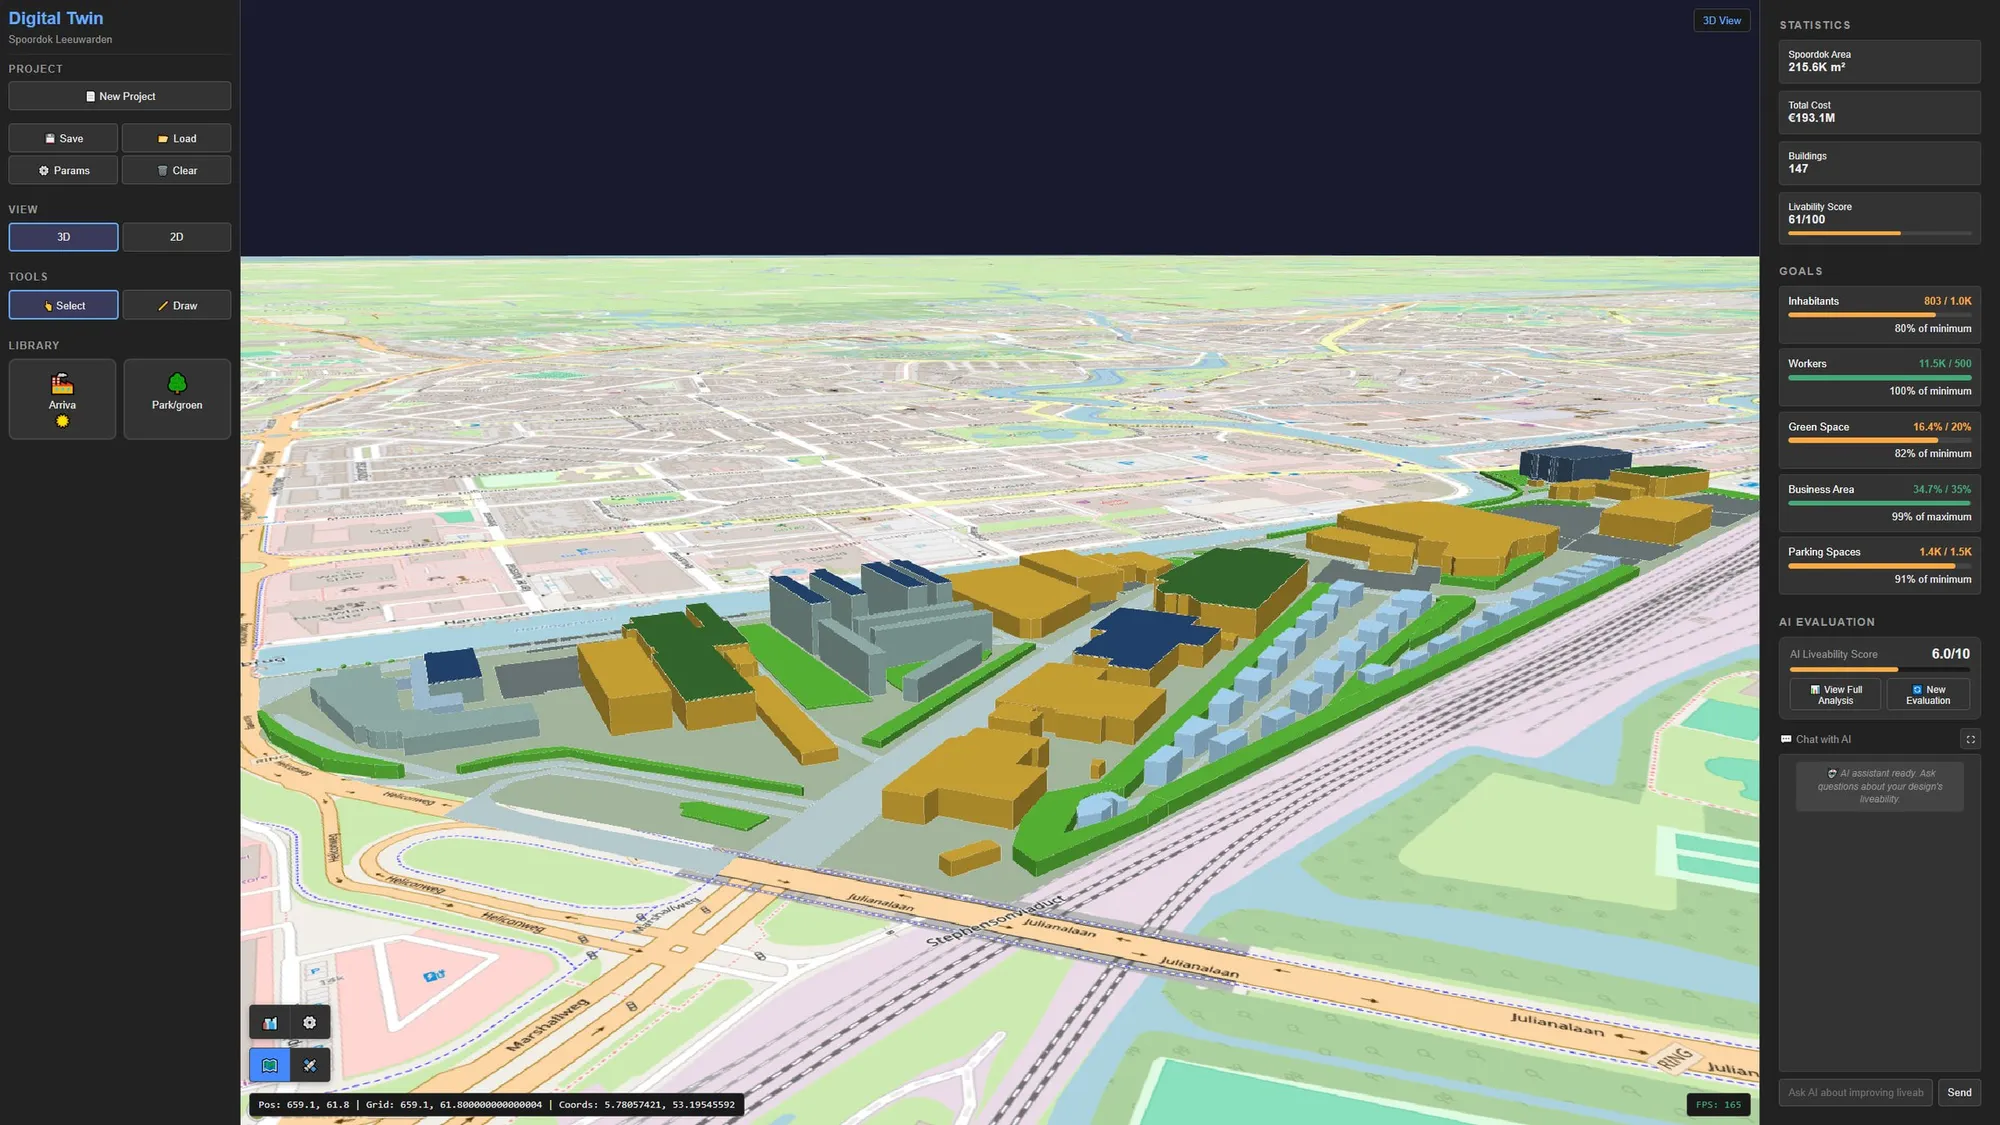
On 21 February the vision model started scoring each view itself, in one step, and a chat assistant was added that answers questions about a finished evaluation with every score in its context.
Demo day and the Rijksontmoetingsplein, March to May 2026
I presented that version at the Leeuwarder Digitale Agenda demo day on 26 March 2026.
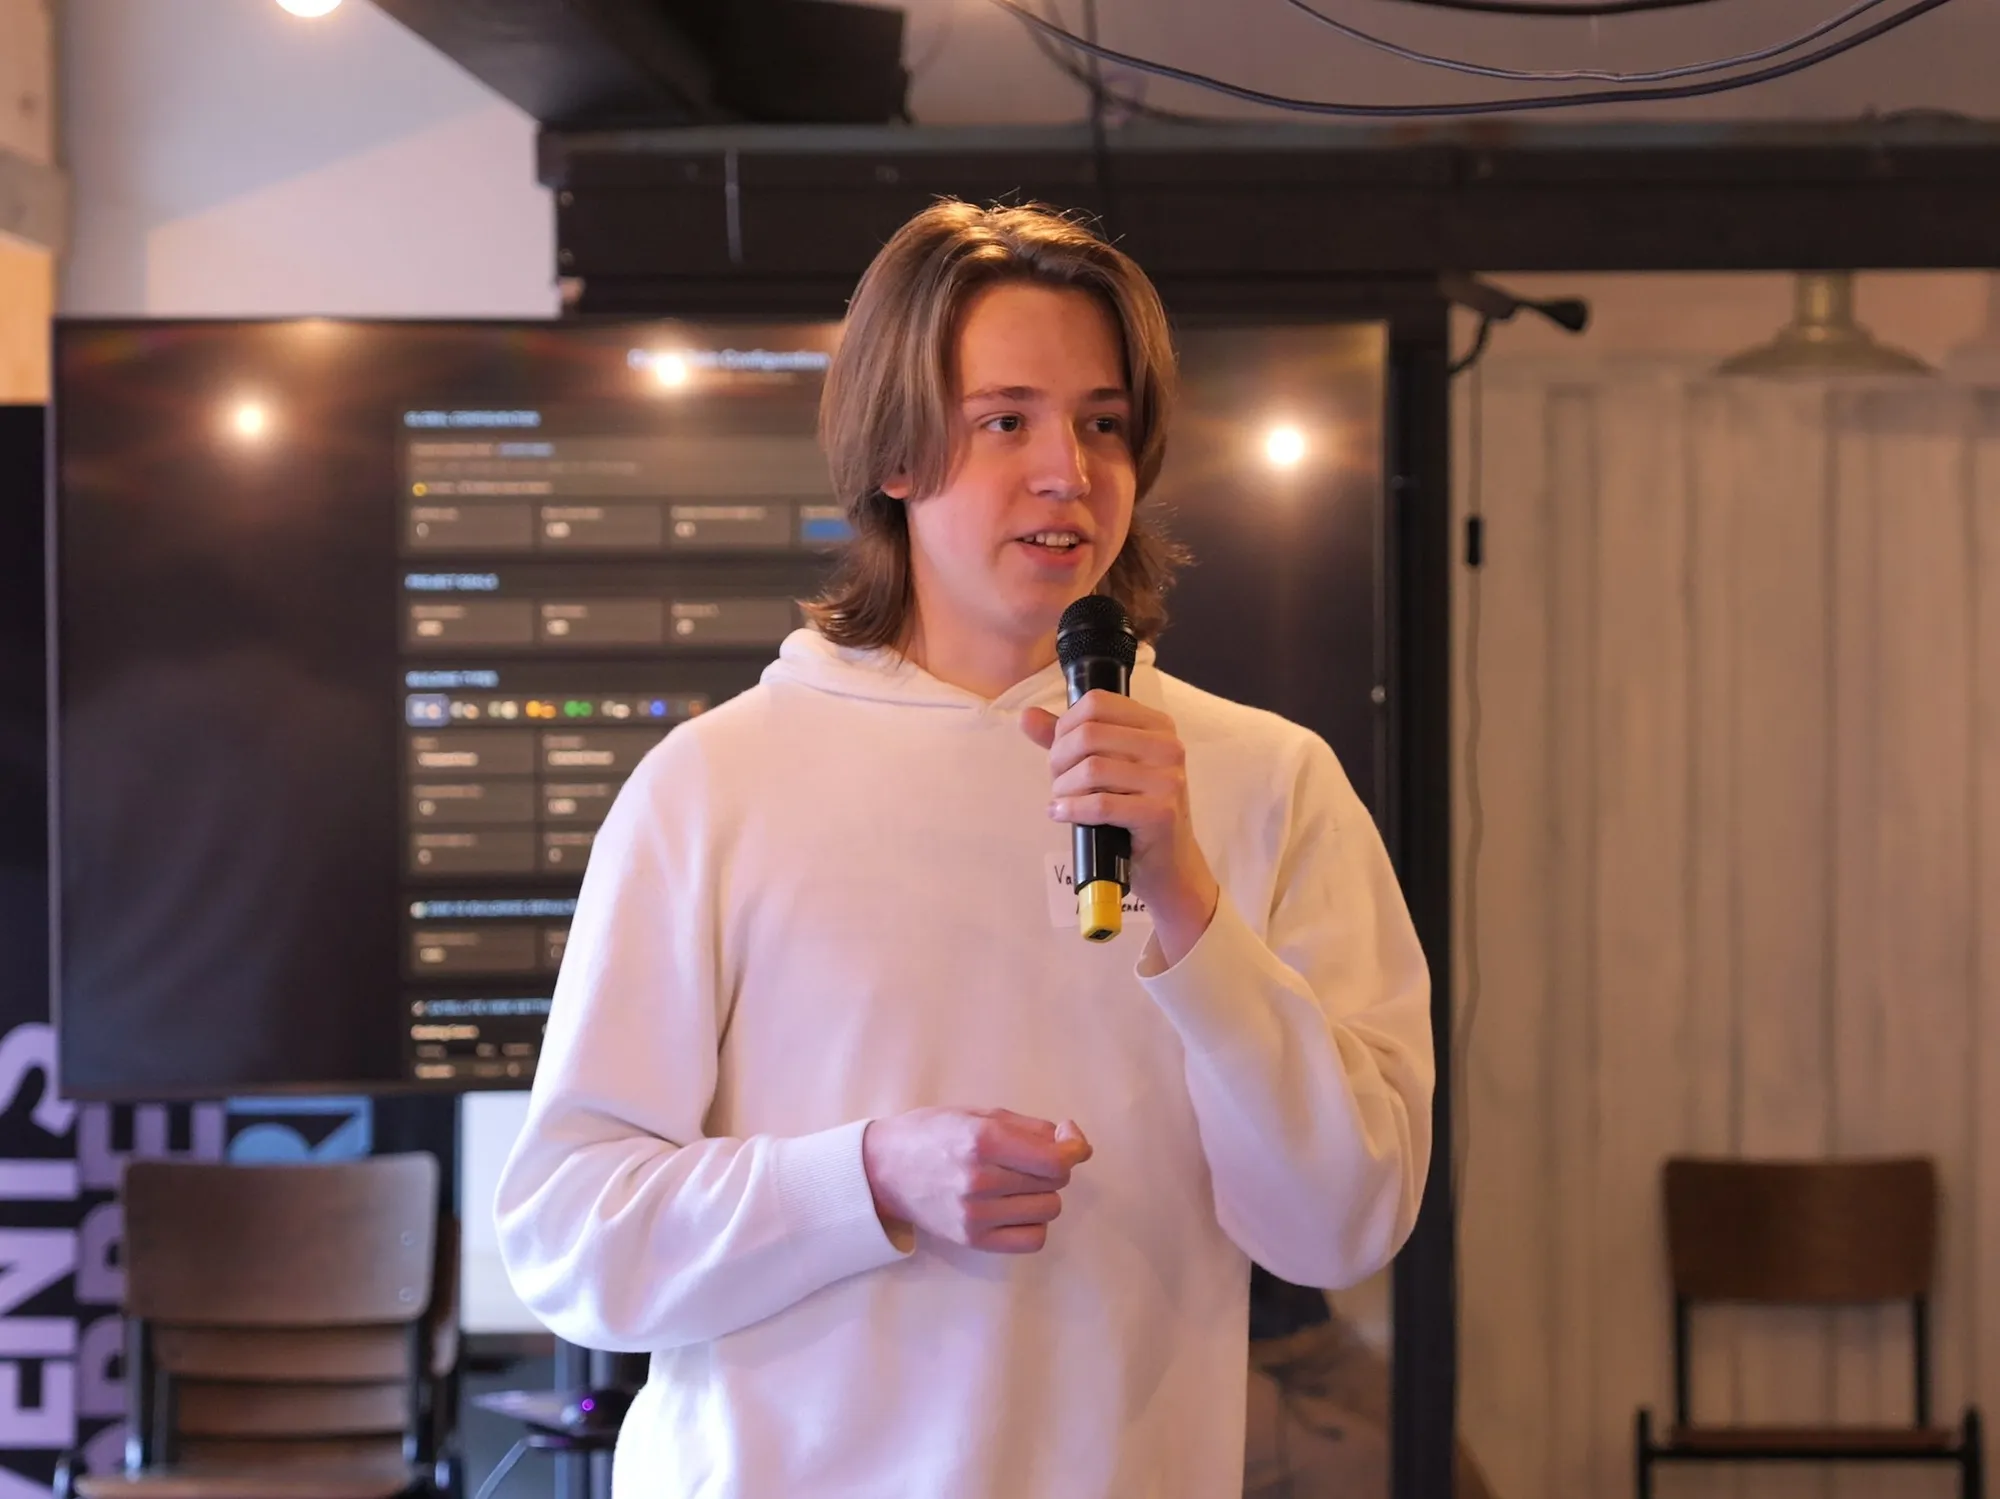
On 18 May 2026 I showed it at the opening of the Rijksontmoetingsplein in Leeuwarden, on the NHL Stenden stand, where the mayor and senior municipal officials stopped to see it.
Streets, parking and trees, June to September 2026
On 30 June parks got trees, and the Docker build was pinned to qwen3.5:9b, one model for
both vision and chat. By July the plan had spline roads, parking lots filled with cars, solar
panels on the roofs and procedural facade textures. From 27 August to 9 September I reworked
the application: the setup screen became a Params dialog, so the map is the first thing on
screen; the tools became four planning layers (buildings, roads, green, parking); building
types can be added, edited and deleted, except one that a building still uses; every edit can
be undone, up to the last 100; and a saved file carries a schema version, is migrated forward,
and is validated in full before anything on the map is replaced. The application runs locally
from one start script, or as three Docker Compose services: the front end, the Flask back
end, and Ollama on the GPU.
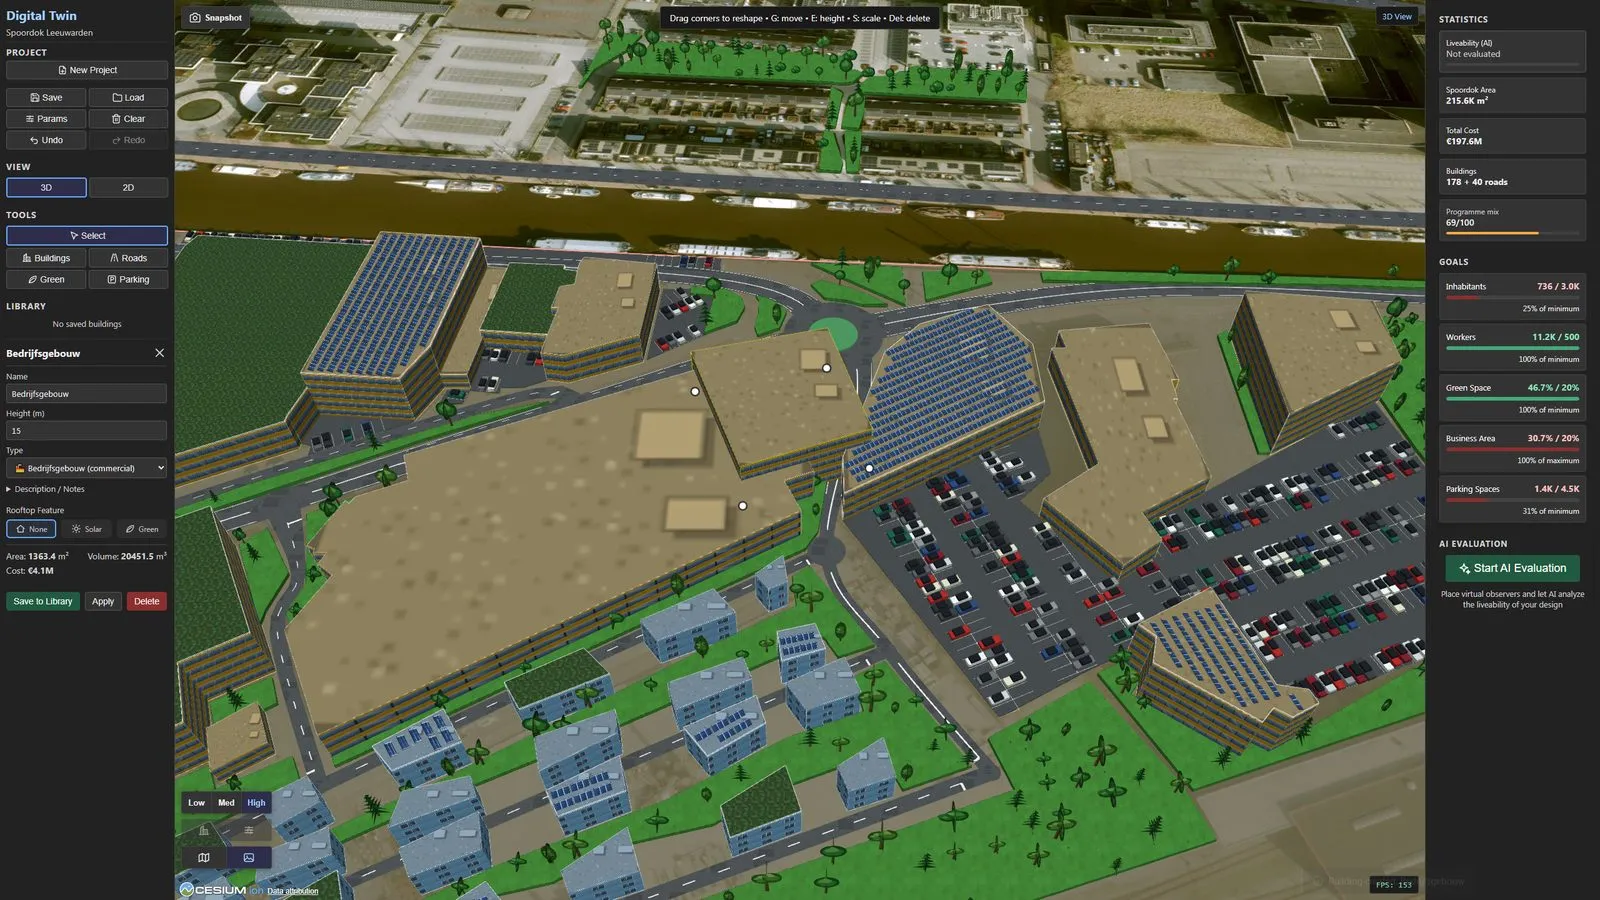
Roads are Catmull-Rom splines on a shared node graph. Where a new road crosses an old one, a junction node is inserted automatically, and dragging that node reshapes every road that uses it. Any junction can become a roundabout with its own ring width and grass island. Pressing E pulls a new road from any selected point, and every point carries its own width, set with S, so a road can widen or narrow along its length. A road can close into a ring and can cross itself; a closed road that crosses itself is not one polygon, so it is cut at every repeated node into the separate rings it really is before its surface is built.
Building outlines can cross themselves too: an outline traced with a crossing in it lost area, because the two lobes of the shoelace sum cancel, and a symmetric bowtie measured 0 m² and cost next to nothing. Such an outline is untangled when it closes: every corner stays where it was placed, and only the order they are joined in changes, by reversing the run of corners between the two crossing edges until no edge crosses another.
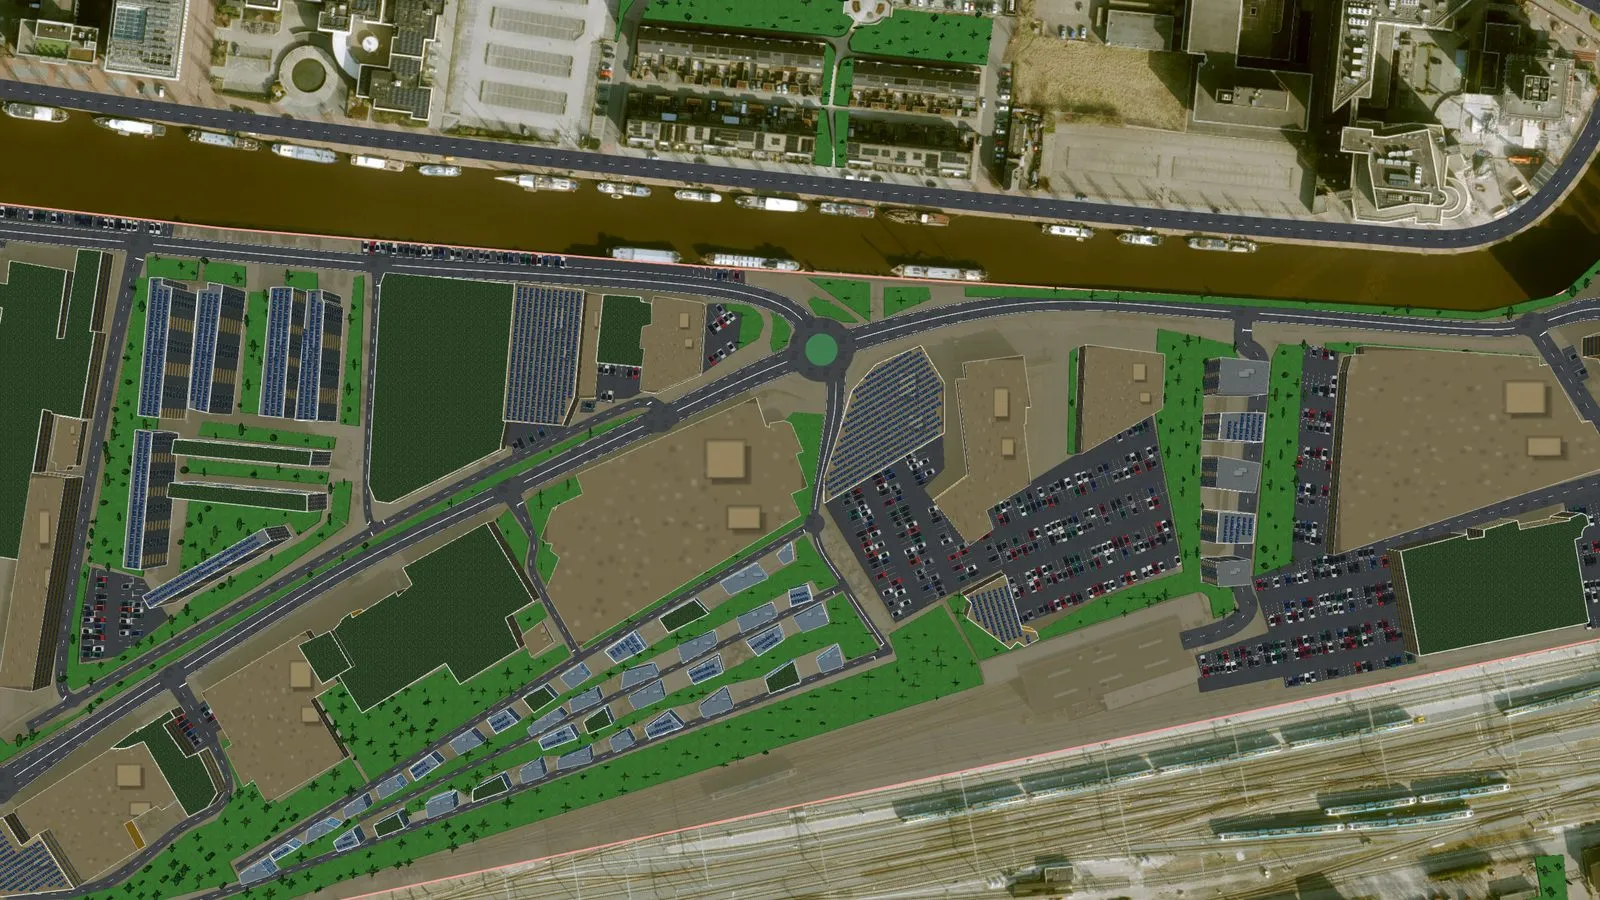
Parking lots are filled by a stall-packing solver: 2.5 × 5 m stalls in double rows with 6 m aisles, turned to whichever direction fits the most stalls, with cars clustered near the entrance. Trees in a park are scattered from a seed made of the park’s id and footprint, so the same park always gets the same trees, and each park is drawn as one batched primitive. The batching cut the test scene from 2,857 Cesium entities to 1,135, and re-solving only the parking lots a road change touches cut a road edit through a lot from 31 ms to about 6 ms.
The evaluation rebuilt, September 2026
In September I rebuilt the evaluation around one camera pose per observer, shared by the preview and the captured photo. An observer is placed with a click on the ground and aimed by dragging, with an eye height from 1.5 to 12 m and a field of view from 60 to 120°.
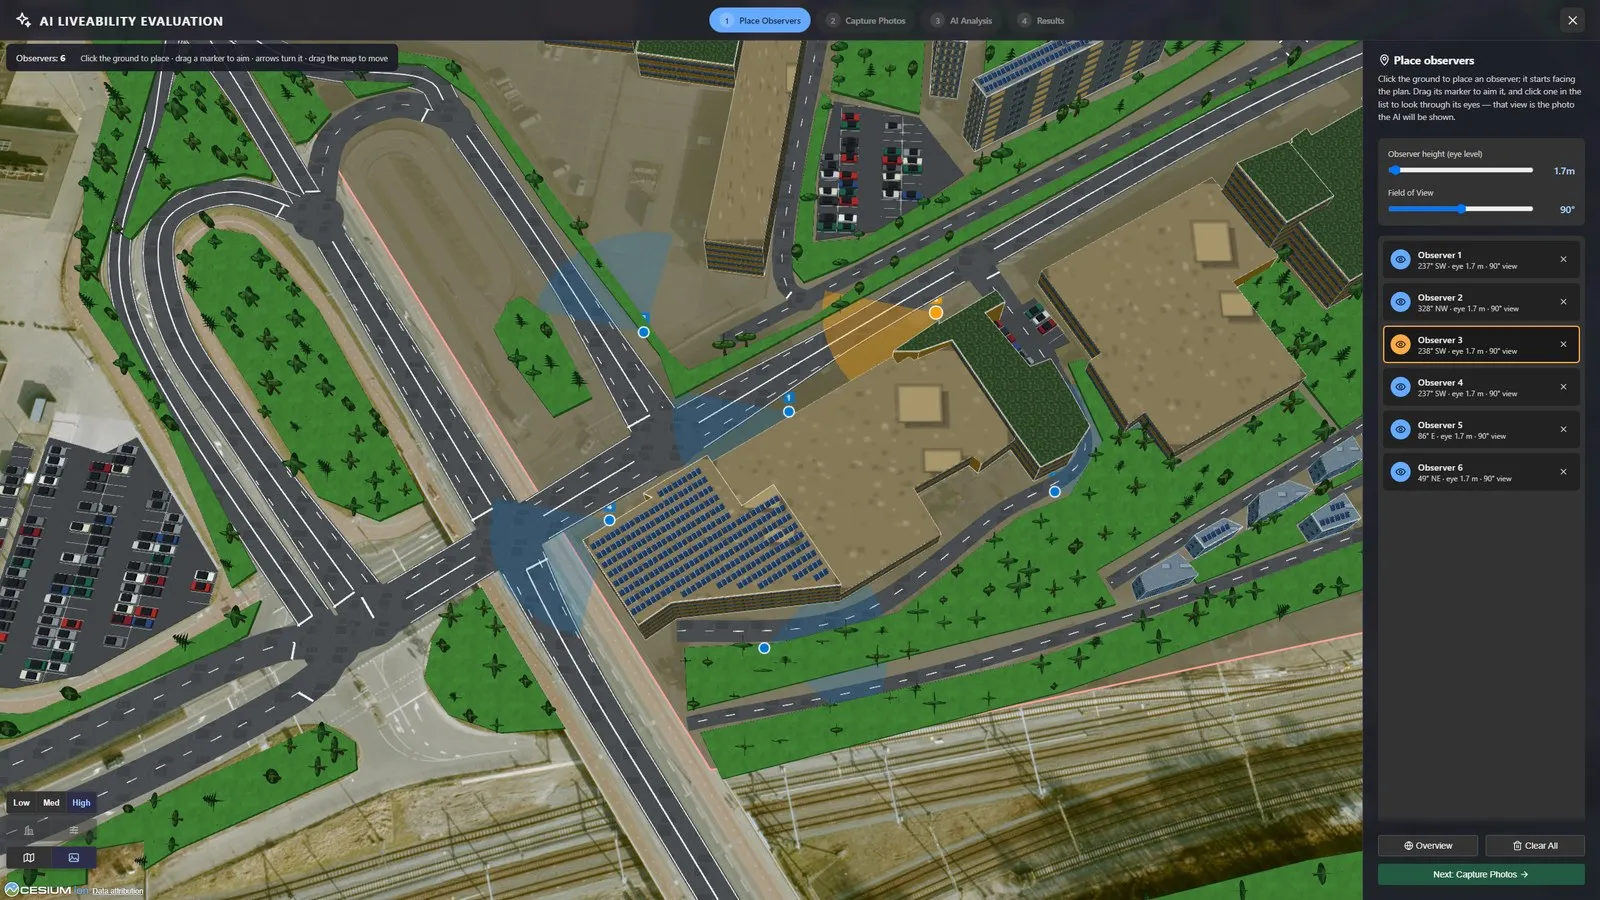
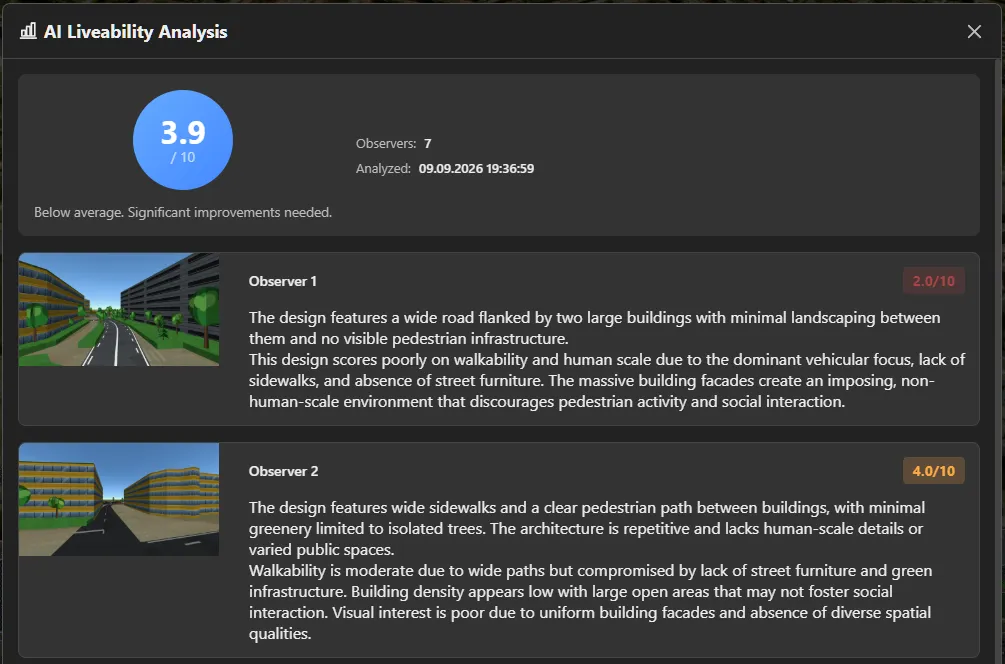
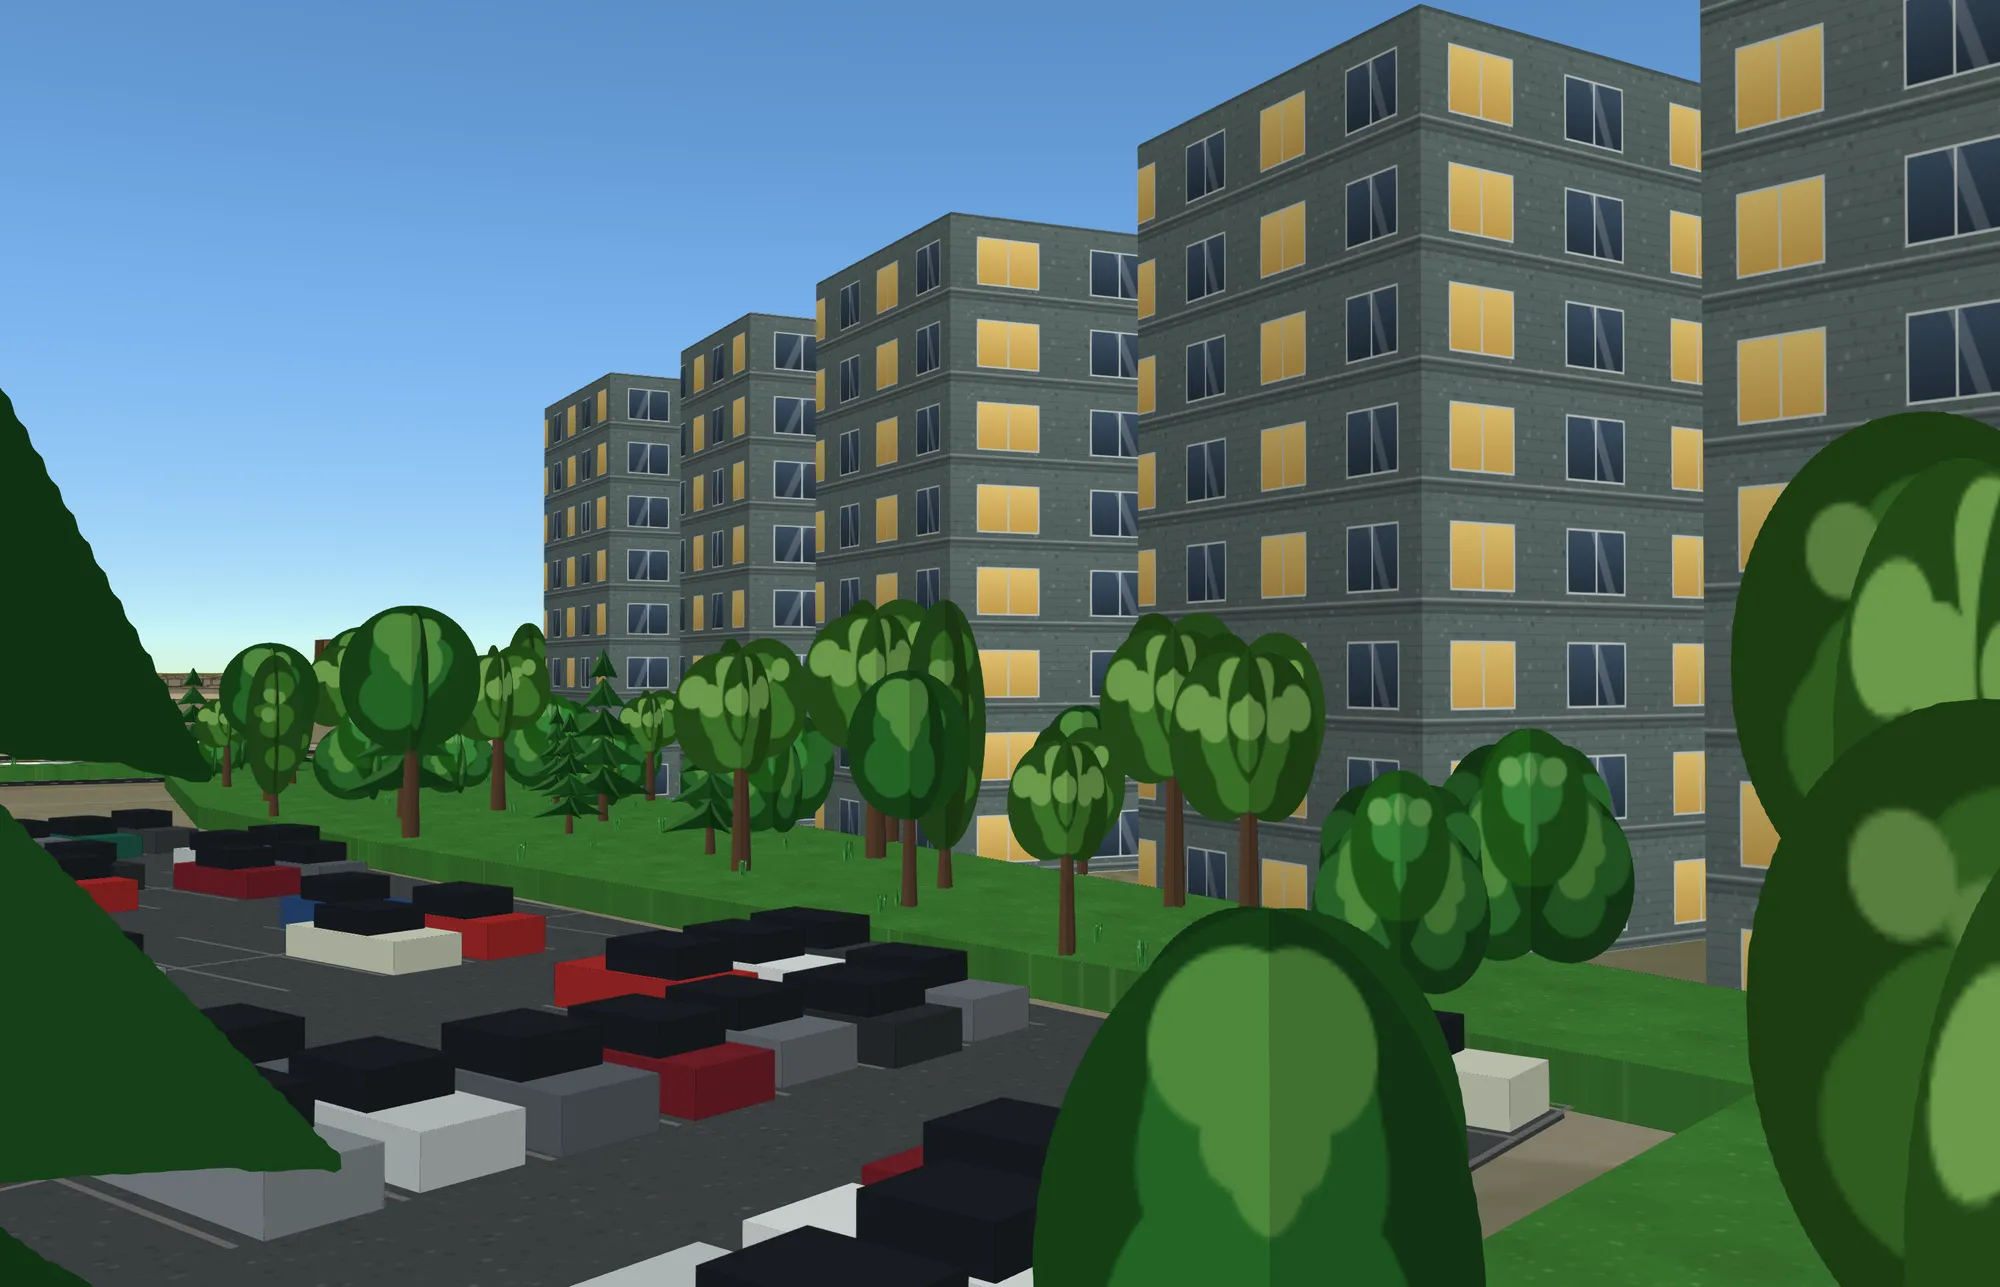
Each capture goes to the vision model with a prompt that says where it stands, as in “from 1.7 m above the ground, looking north-west”, and the model has to answer with JSON matching a schema: a description, an analysis and a whole-number score from 0 to 10. With the model’s thinking turned off and its output constrained to that schema, a photo went from 160 seconds to about 11 once the model is loaded. At temperature 0.7 the same image scored 4, 8 and 4 on three runs; at 0.15 it scored 5, 4 and 5, so the analysis now runs at 0.15. The chat model gets every score, each observer’s eye height and direction, and the plan’s own numbers, and can be asked what to change. Every score is saved with the position, heading, eye height and field of view it came from, so a low score can be traced back to a spot in the plan.
At Spoordok’s latitude (53.2° N) a degree of longitude covers 0.6 of the ground distance of a degree of latitude, so taking the angle straight from the coordinate differences read a point exactly north-east as 59° instead of 45°, and every observer looked somewhere other than where its arrow pointed. The bearing is now computed in ground metres, with longitude scaled by the cosine of the latitude, and a test checks both the right answer and that the old formula would miss by more than 10°.
The other way I get a real place into a 3D scene is photogrammetry, from photographs instead of a map.