Sensor display
An ESP32 sensor node whose charts are drawn by my Flask server and streamed back as raw RGB565 pixels, one panel row at a time; later one of the two nodes of my IoT project, graded 10.0.
| Board | ESP32-WROOM-32 DevKit |
| Panel | 2.4-inch 320×240 ILI9341, SPI at 10 MHz |
| Sensors | AHT20 and BMP280 on one software I²C bus, MPU6500 IMU on a second, a touch sensor from January 2026 |
| Server | Flask and matplotlib on PythonAnywhere, answering with raw RGB565 |
| Links | HTTP to the server, ESP-NOW from the radio controller, MQTT to a broker |
| Firmware | MicroPython, with rdagger's ILI9341 driver |
| Case | printed, first version October 2024, second December 2025 (revised January 2026) |
| Course | NHL Stenden, Project Internet of Things, 10.0 |
An ESP32 with a 2.4-inch 320×240 panel and sensors for temperature, humidity, pressure and motion. It posts every reading to a Flask server I run on PythonAnywhere, and the server answers with a finished matplotlib chart as 153,600 bytes of raw RGB565, which the board writes to the panel one row at a time without decoding anything. In January 2026 it moved into a second printed case and, with an MQTT program, became one of the two nodes of my NHL Stenden Internet of Things project, graded 10.0.
October 2024: the panel and the first case
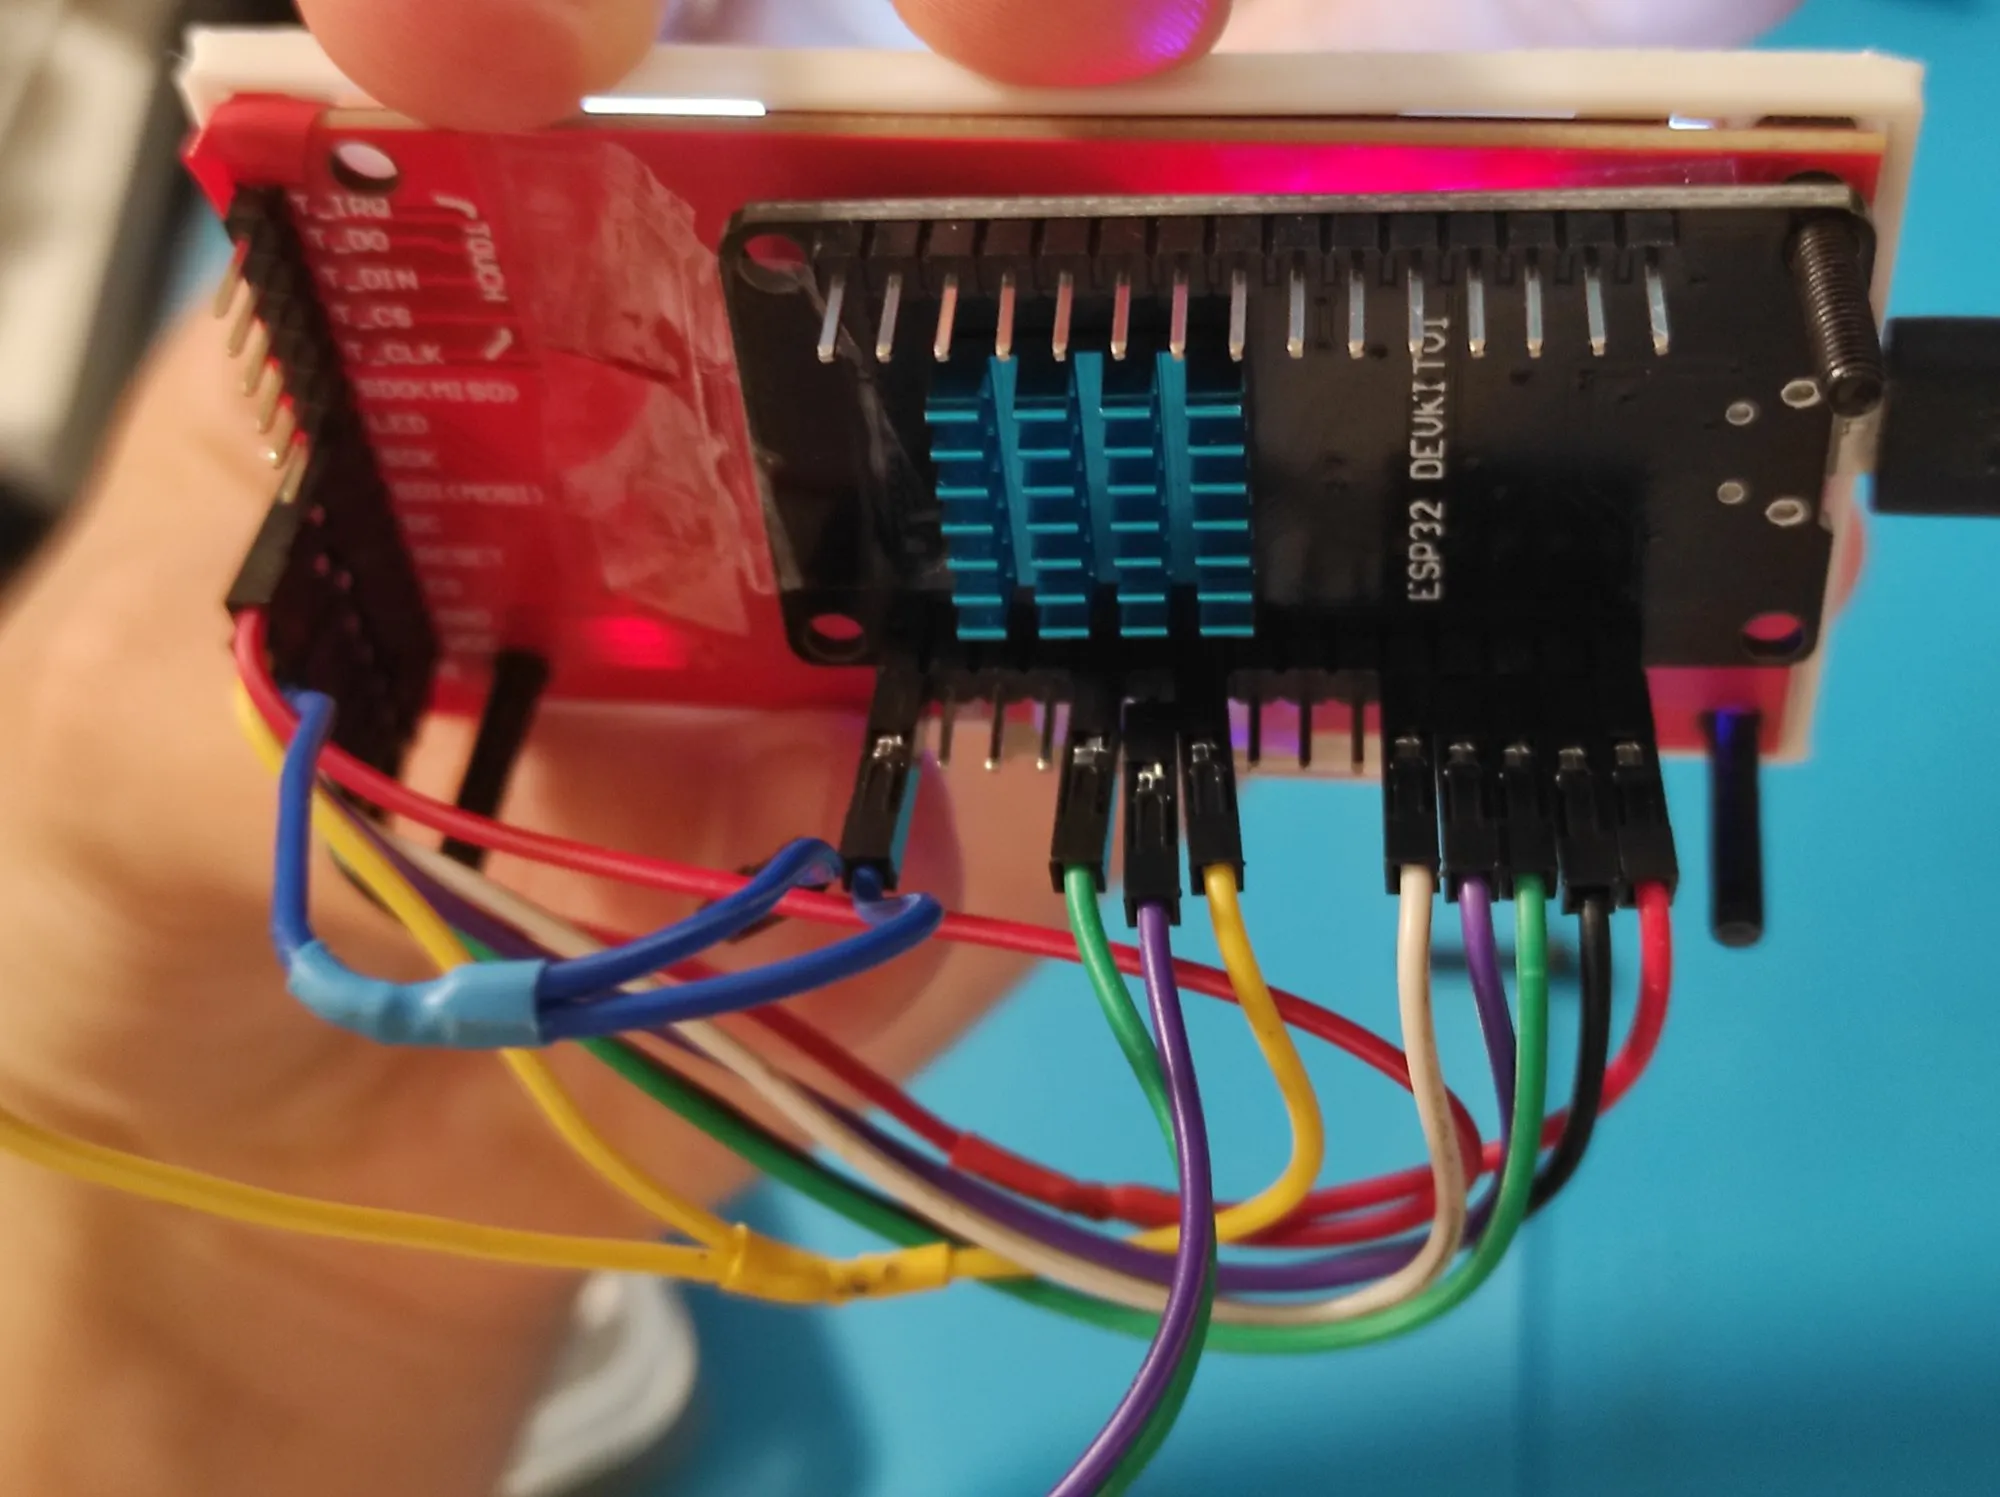
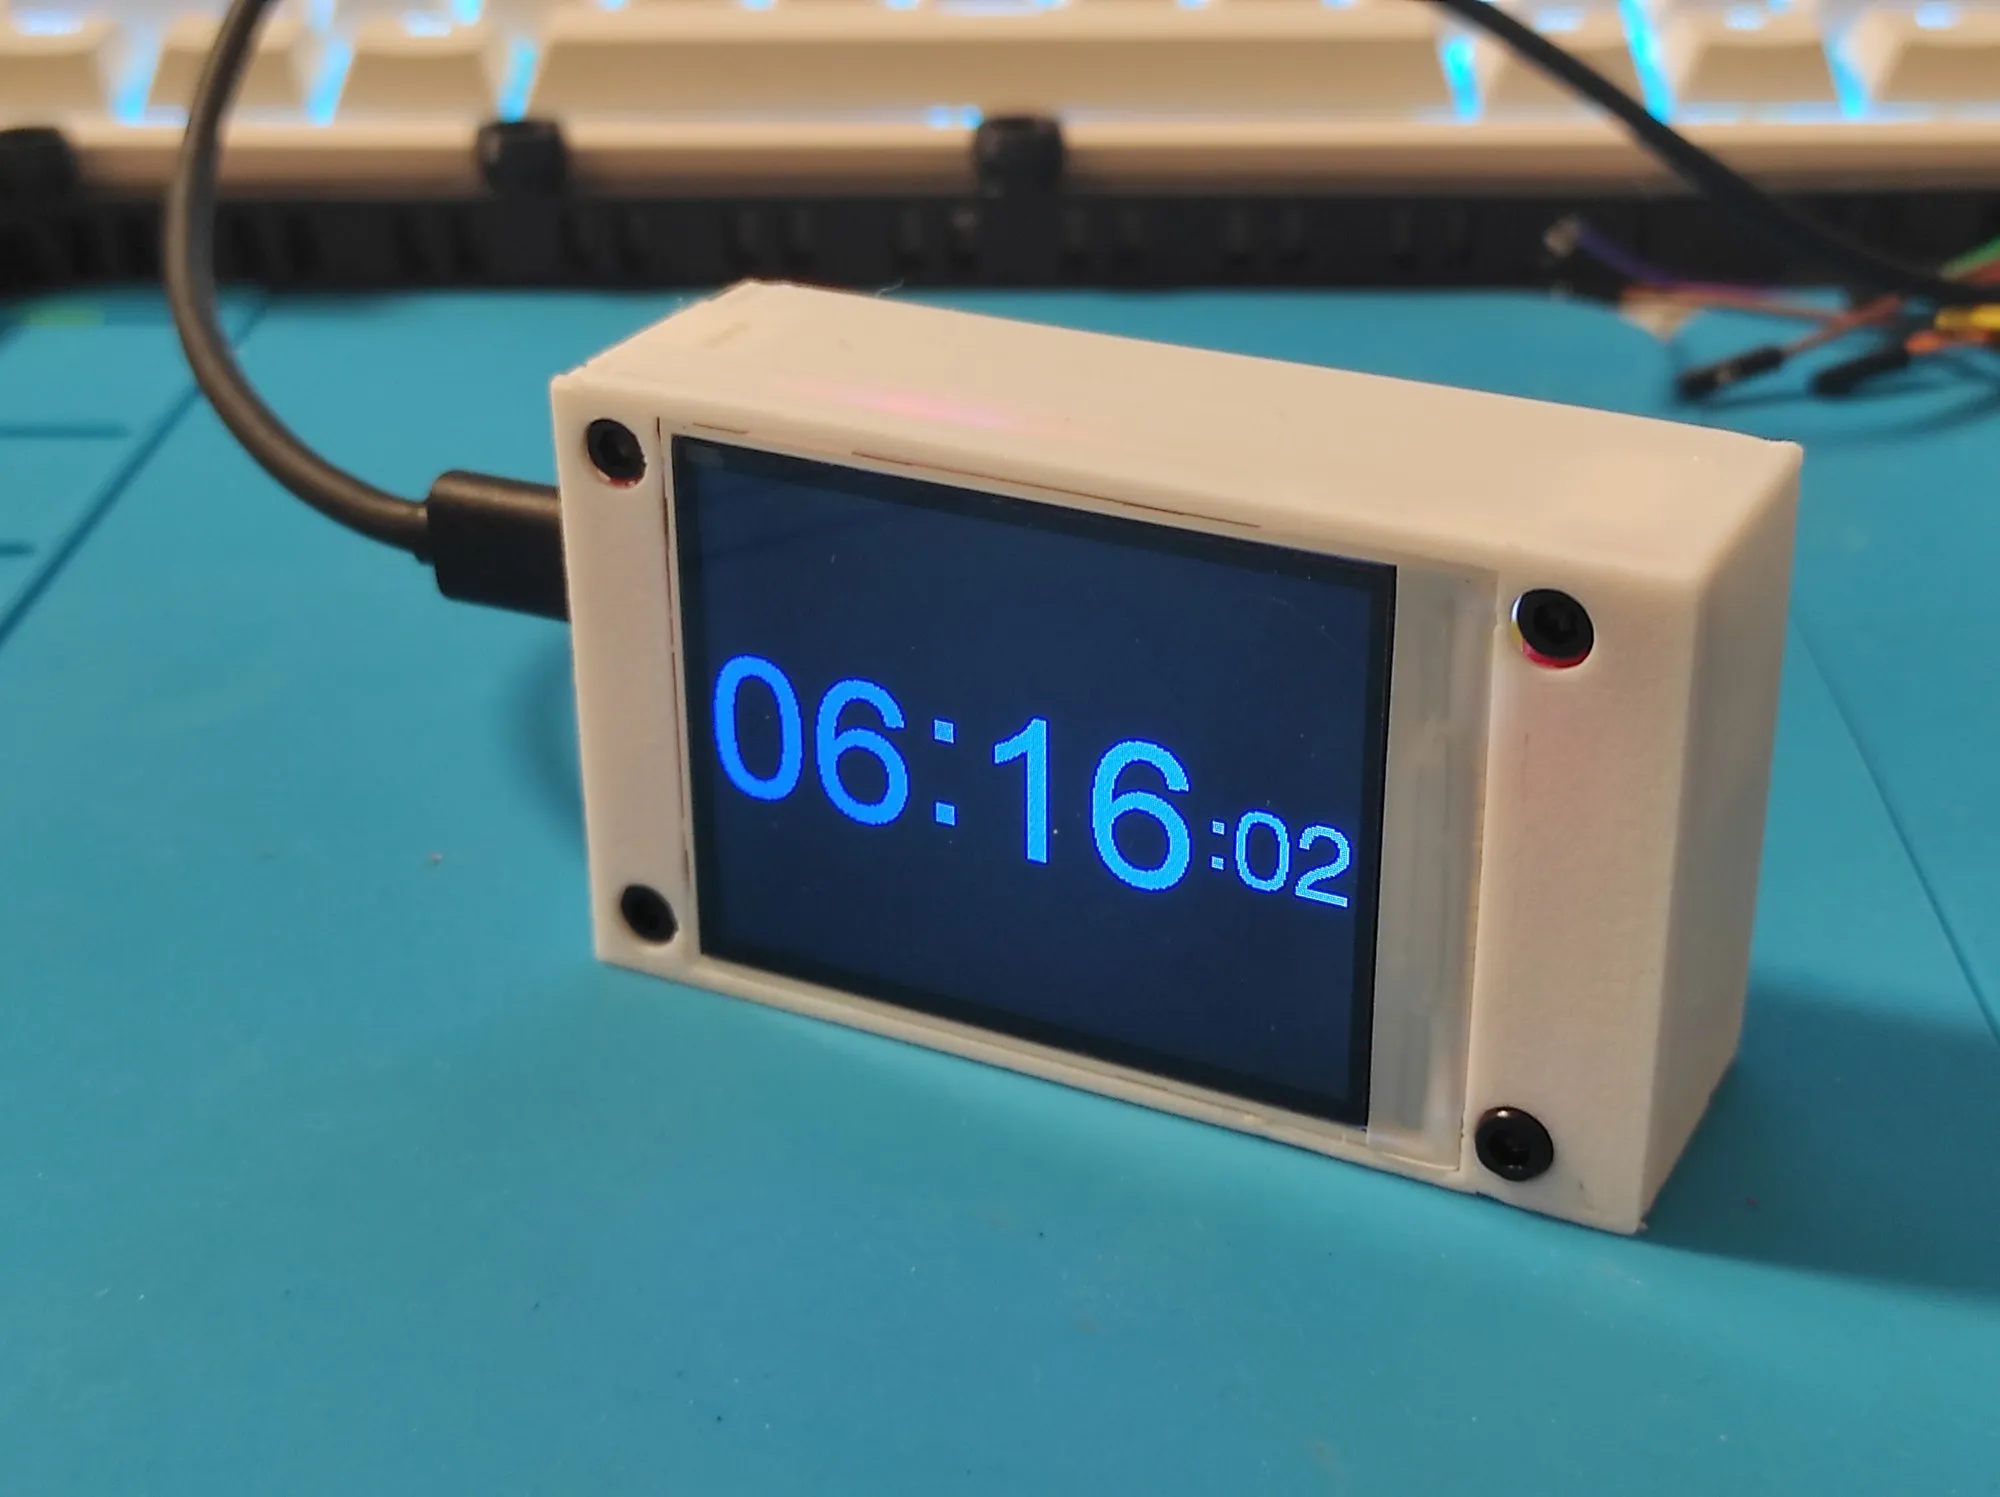
The panel is an ILI9341 module on a red breakout board, wired to an ESP32 DevKit with jumpers. It first ran two example sketches from the TFT_eSPI library, an analogue meter and a digital clock, while I modelled the case in Blender: an 80 × 46 mm box with a separate front plate.
February to May 2025: server-drawn charts, then a radio link
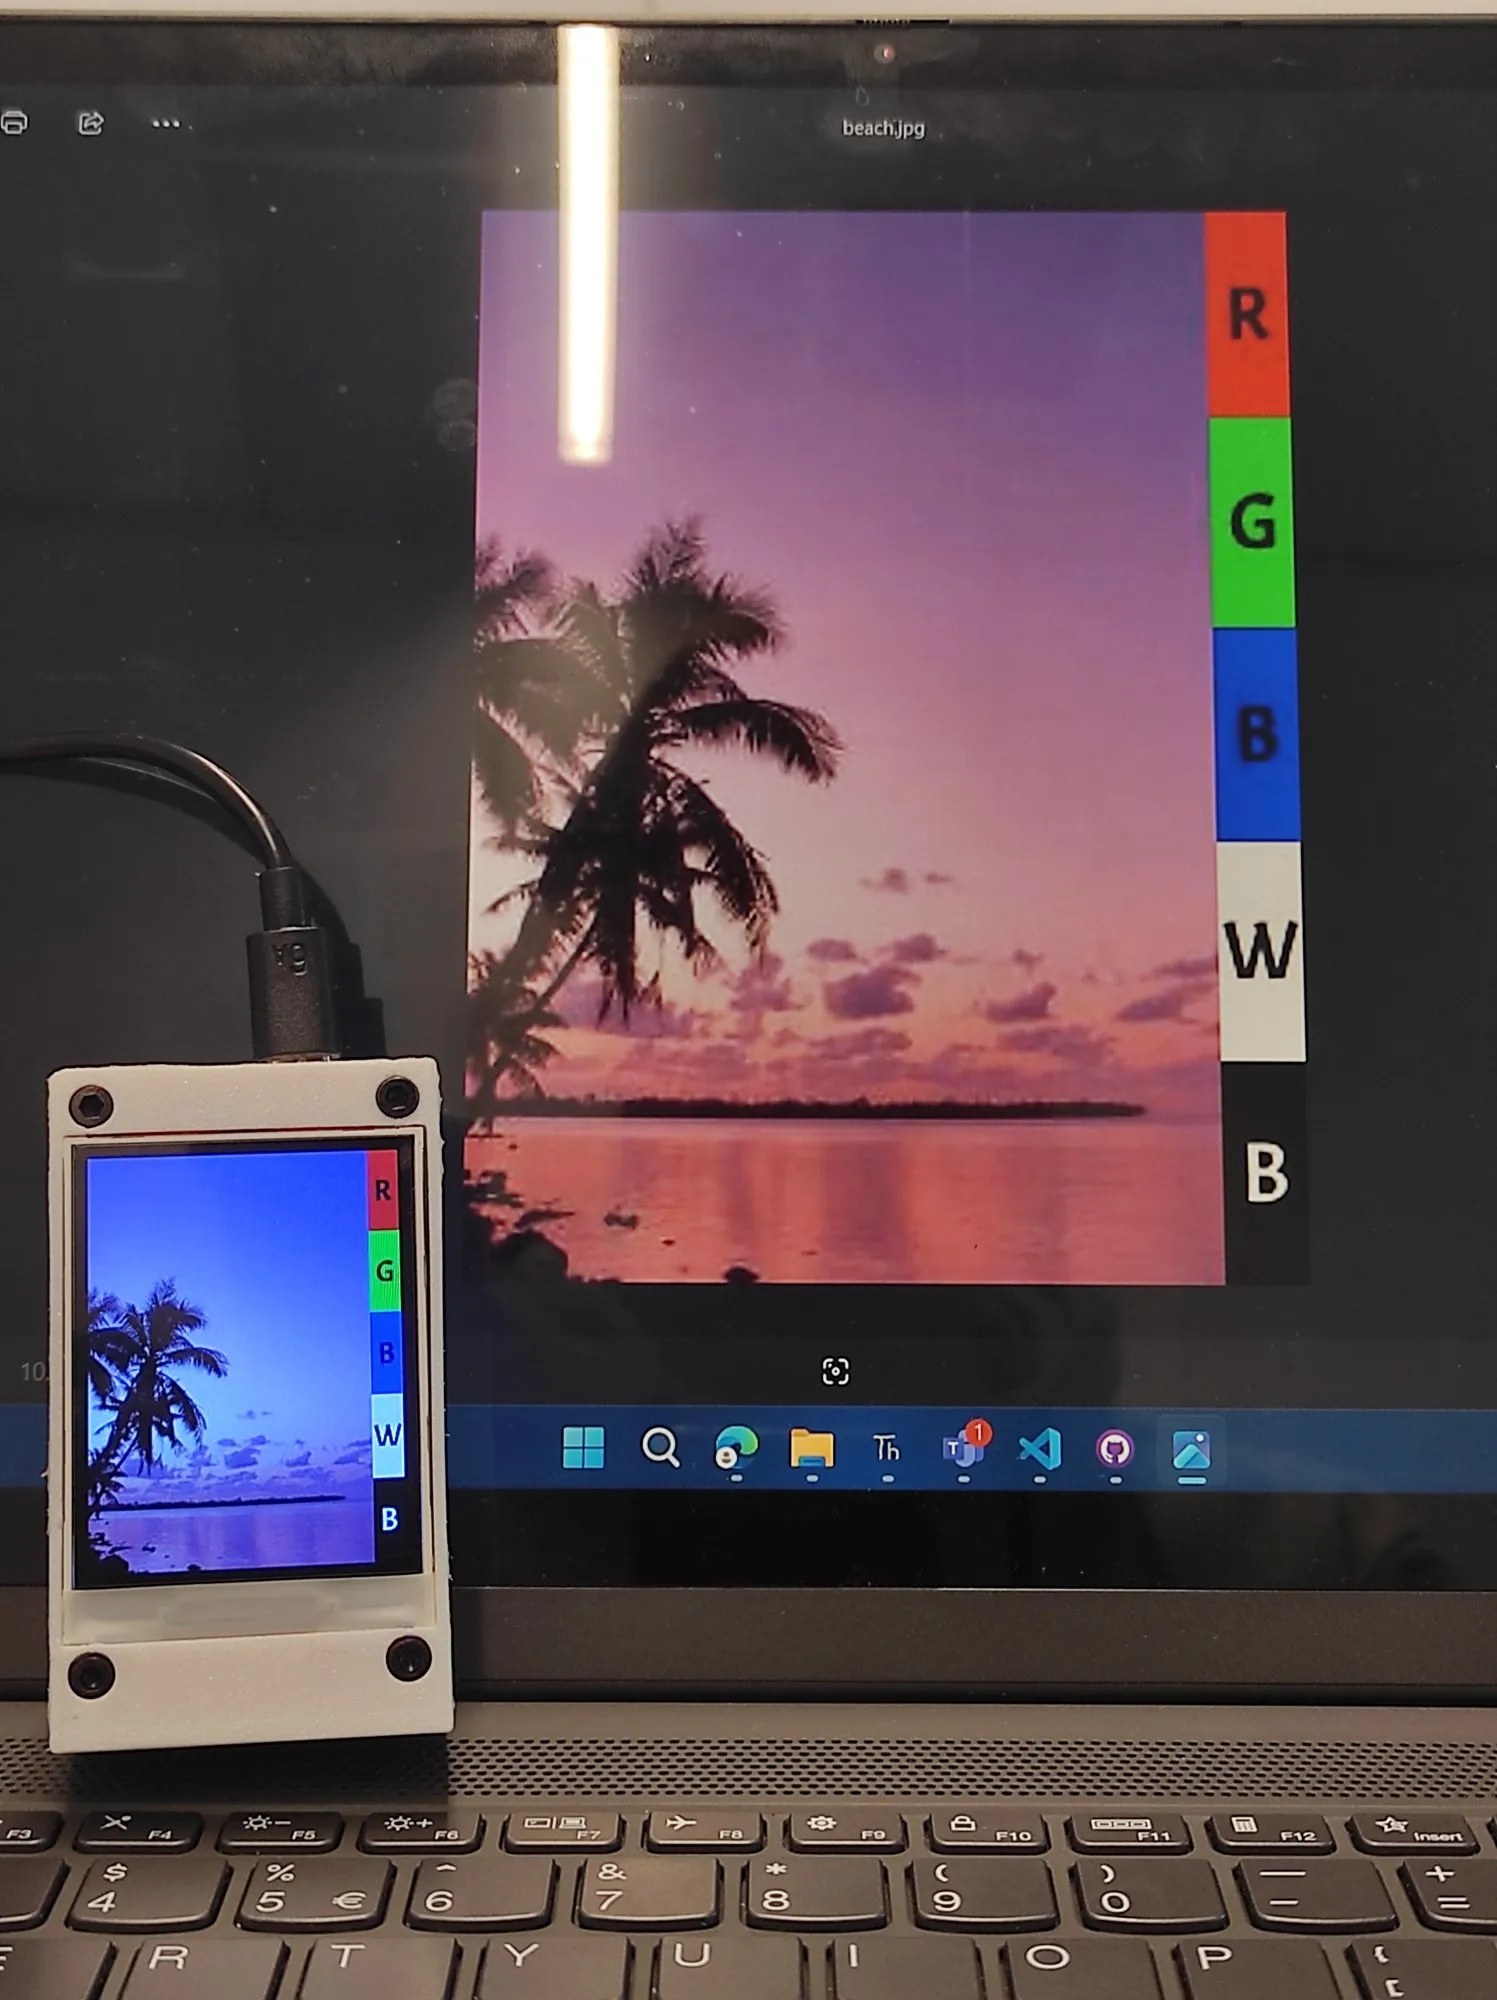
By February 2025 the firmware was MicroPython and the sensors were wired in: an AHT20 and a BMP280 share one software I²C bus, and an MPU6500 IMU sits on a second. The first frames sent as raw pixels, on 3 February, kept their shapes and lost their colours. They were packed low byte first, the order a PC stores a 16-bit number in, while the ILI9341 reads each pixel high byte first. Read the wrong way round, every pixel’s least significant bits become its most significant ones, so smooth shading turns into coloured noise and the edges survive. I traced it to the byte order and swapped the two bytes of every pixel before sending; the next day’s test image was clean, and the server’s converter still does that swap.
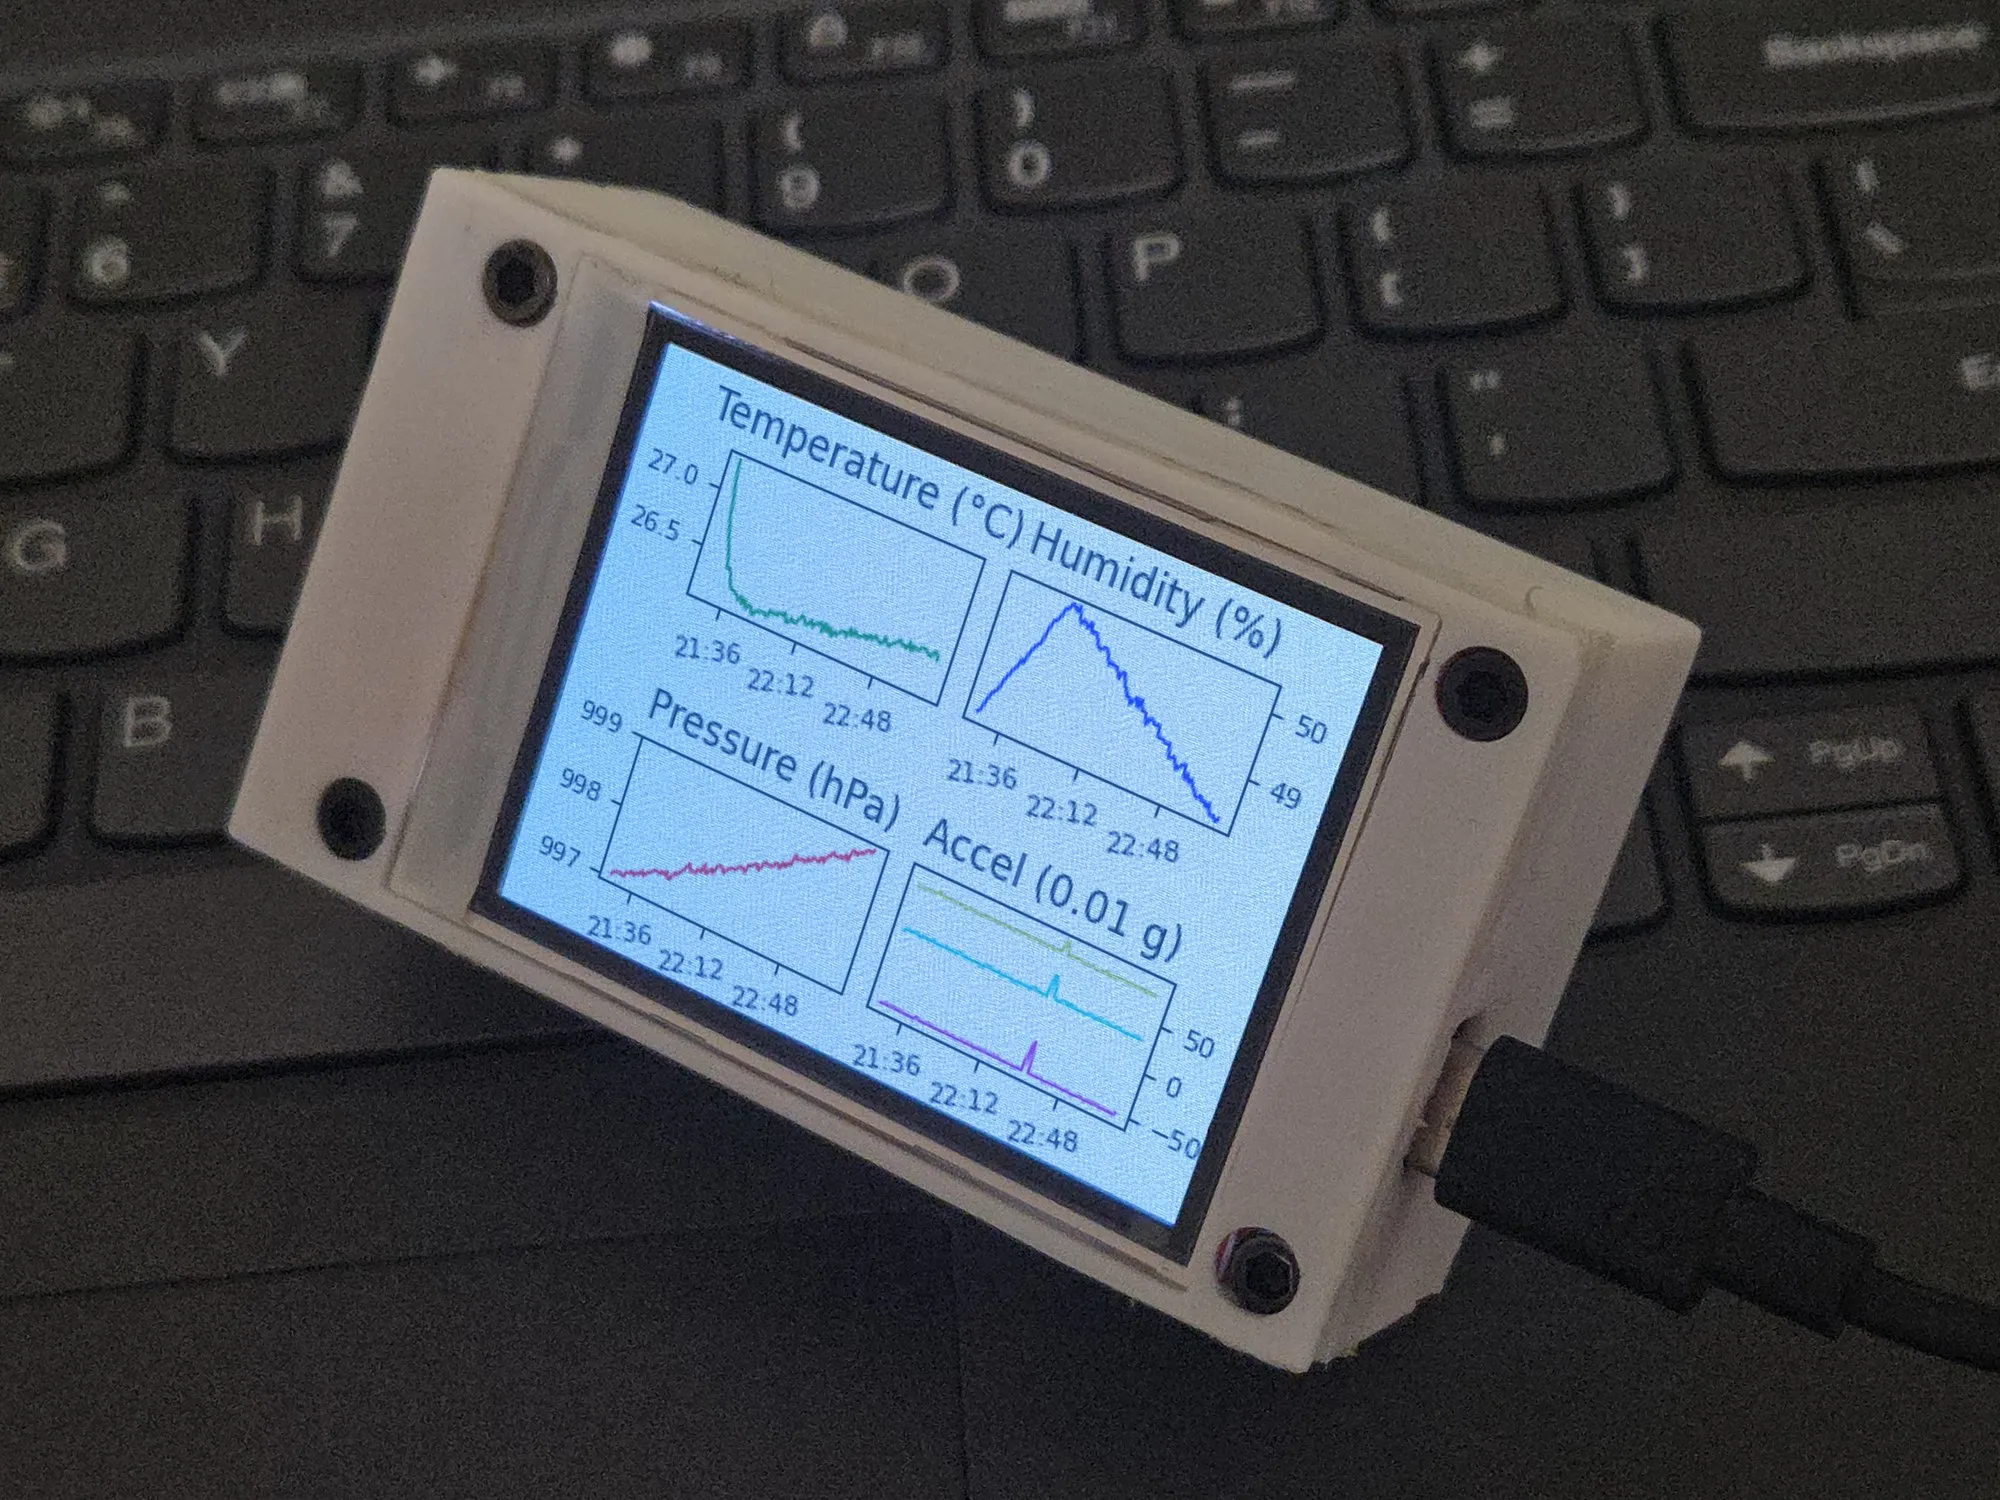
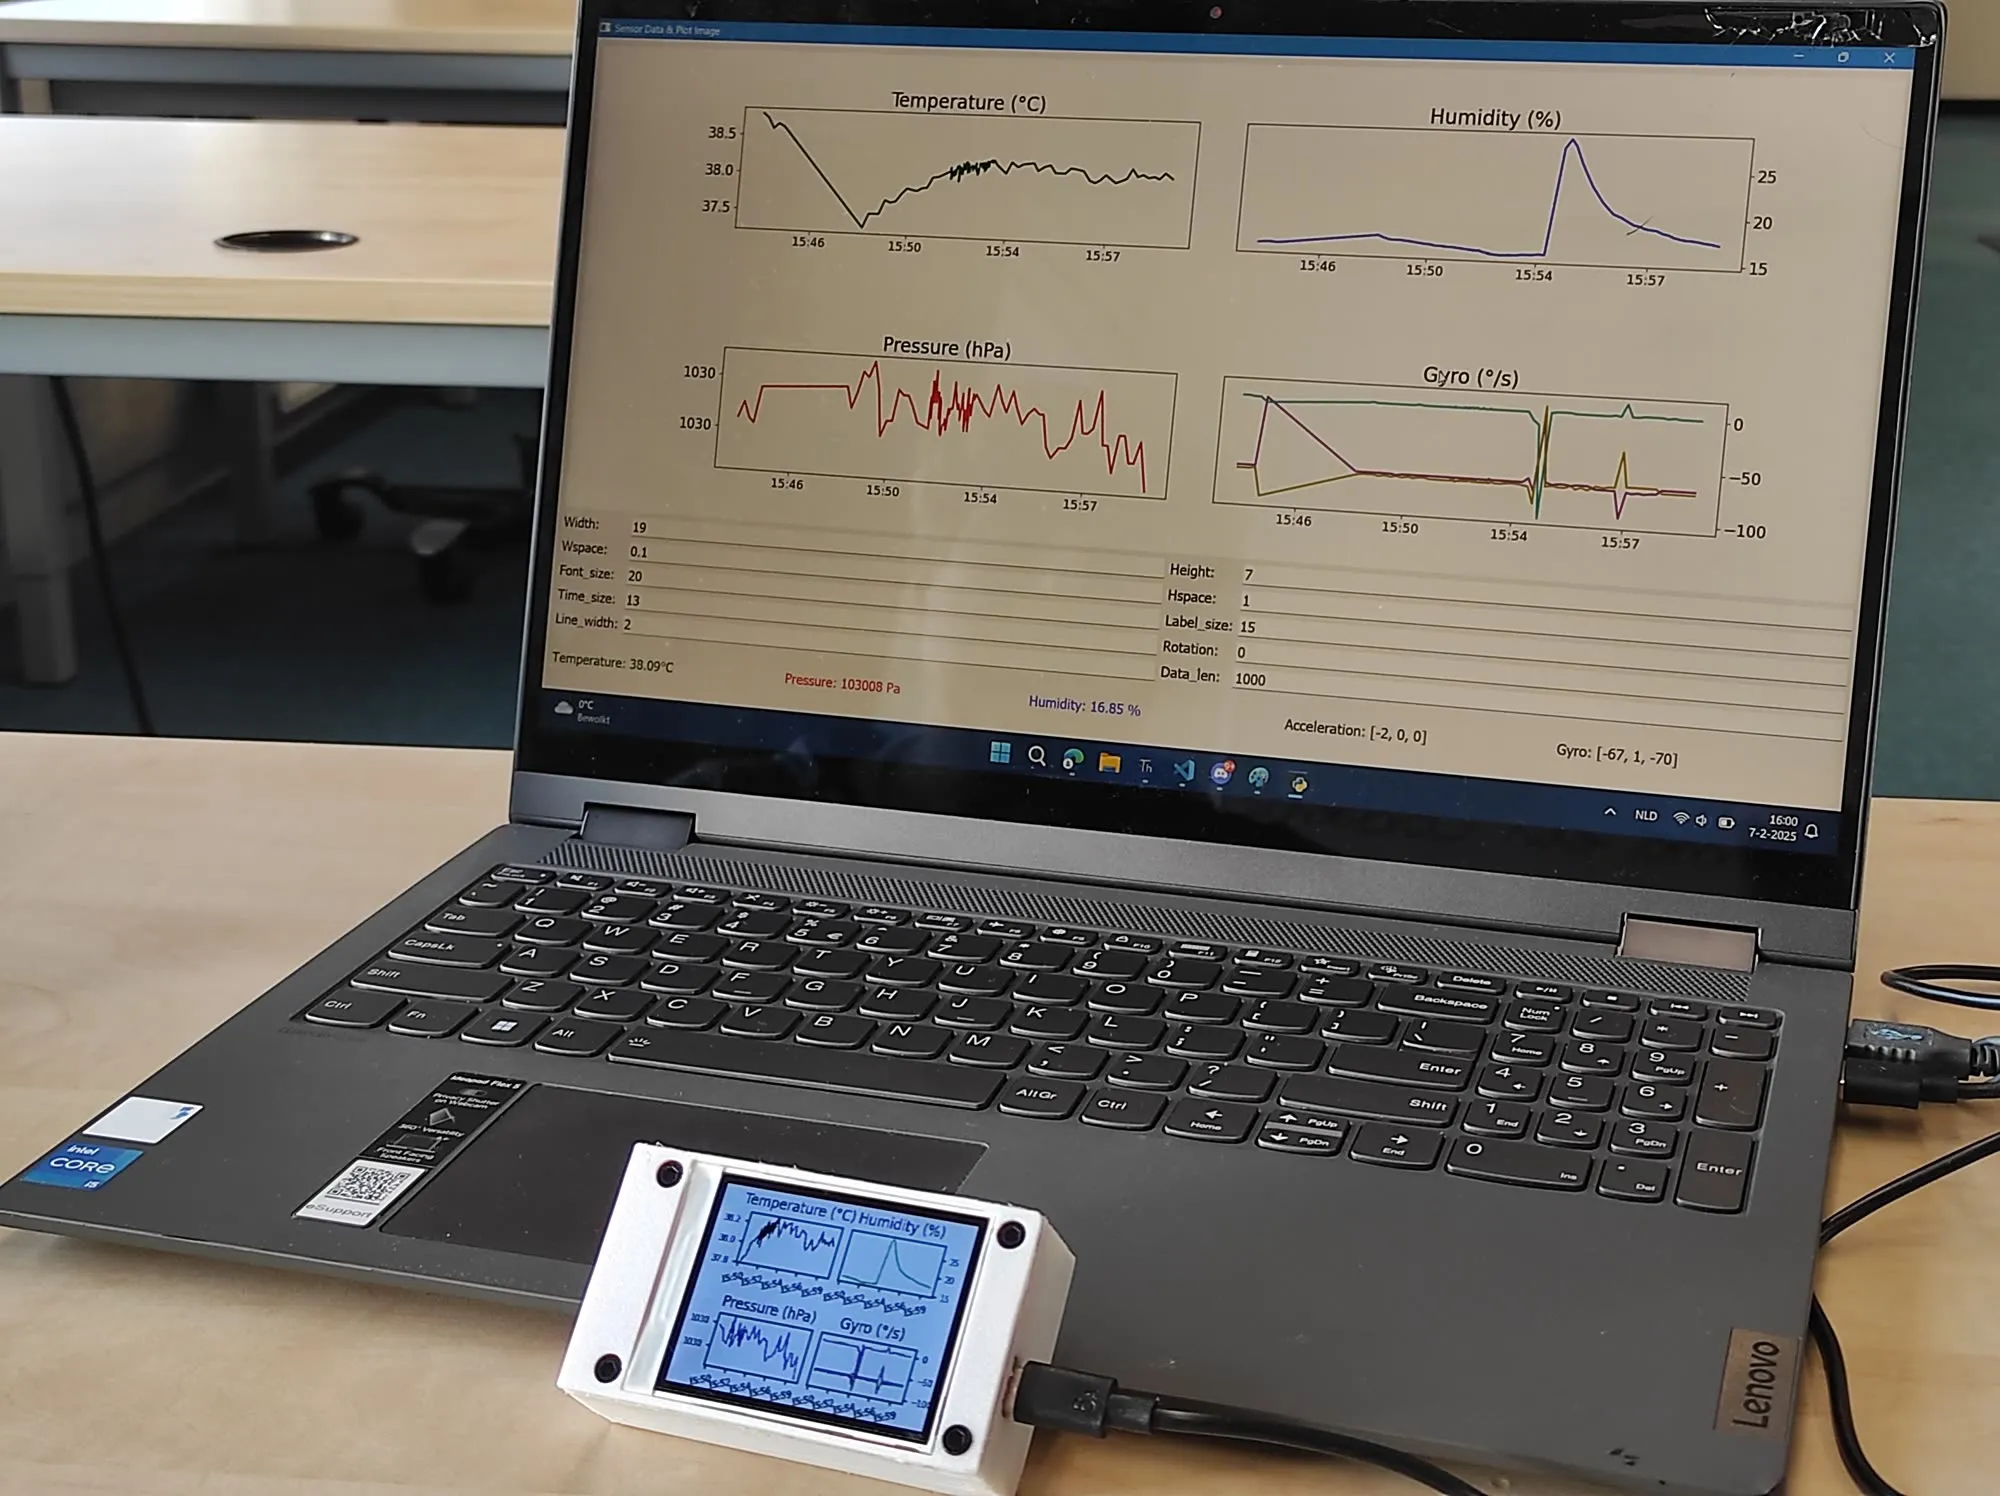
The loop itself is two requests. The board posts a reading as JSON, then asks for the chart. The server keeps the last 1,000 readings in memory and plots the latest 100 as four panels (temperature, humidity, pressure, acceleration) on a 3.2 × 2.4 inch figure at 100 dpi, which is exactly 320 × 240 pixels. The last panel carries the title Gyro (°/s) but plots acceleration in hundredths of g: the firmware sends the two IMU vectors under each other’s names. It rotates the image 90° to match the order the board writes it in, converts it and sends the raw bytes. The firmware reads the response 480 bytes at a time, one line of 240 pixels, and hands each line to the panel over the 10 MHz SPI bus: 320 reads per frame, no image format, and never more than one line in memory. There is no timer; the next reading goes out as soon as the frame is on the panel.
A PyQt5 desktop app requests the same four-panel chart at laptop size, with every render parameter (figure size, panel spacing, font and label sizes, tick rotation, line width, how many readings) as a live field.
From 26 February 2025 the board was also the receiving screen for my handheld radio controller, redrawing its joystick view from each ESP-NOW packet. In May 2025 I added a scan screen: when none of the board’s known WiFi networks is in range, it lists the networks it can see, strongest first. The same month the board went into a video of my ESP32 builds.
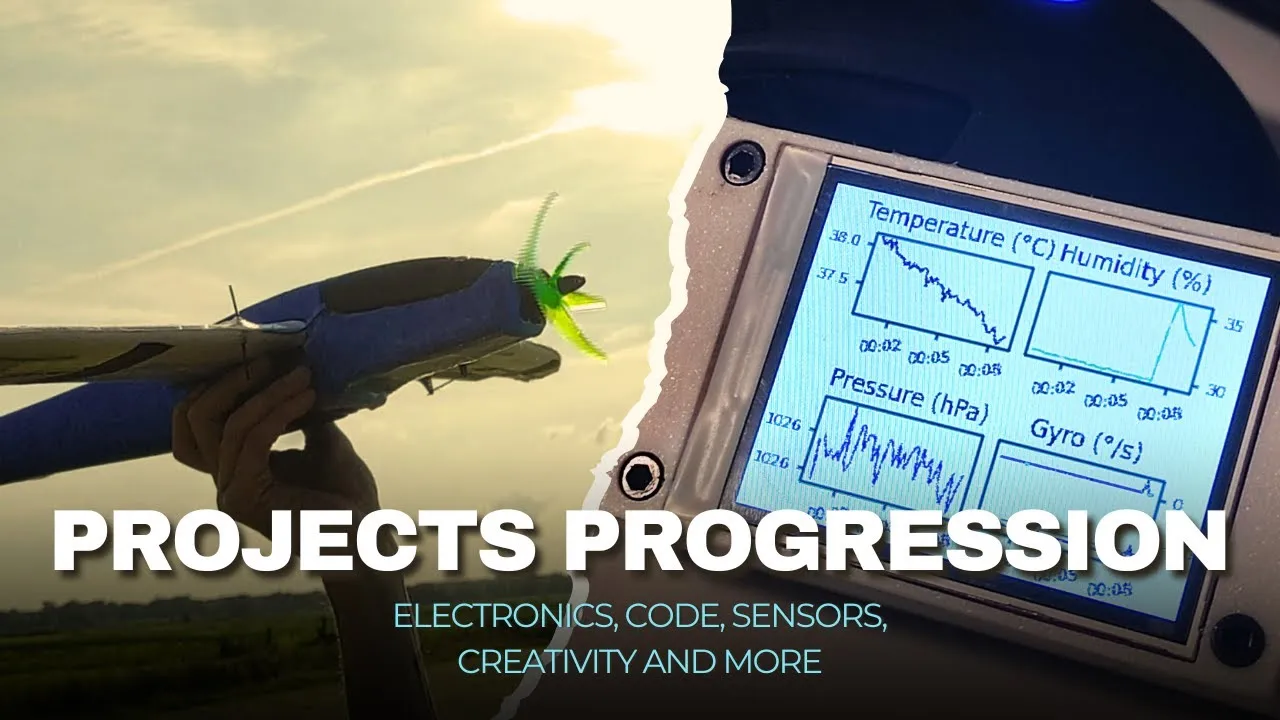 The sensor display in the showcase
December 2025 to January 2026: the IoT project
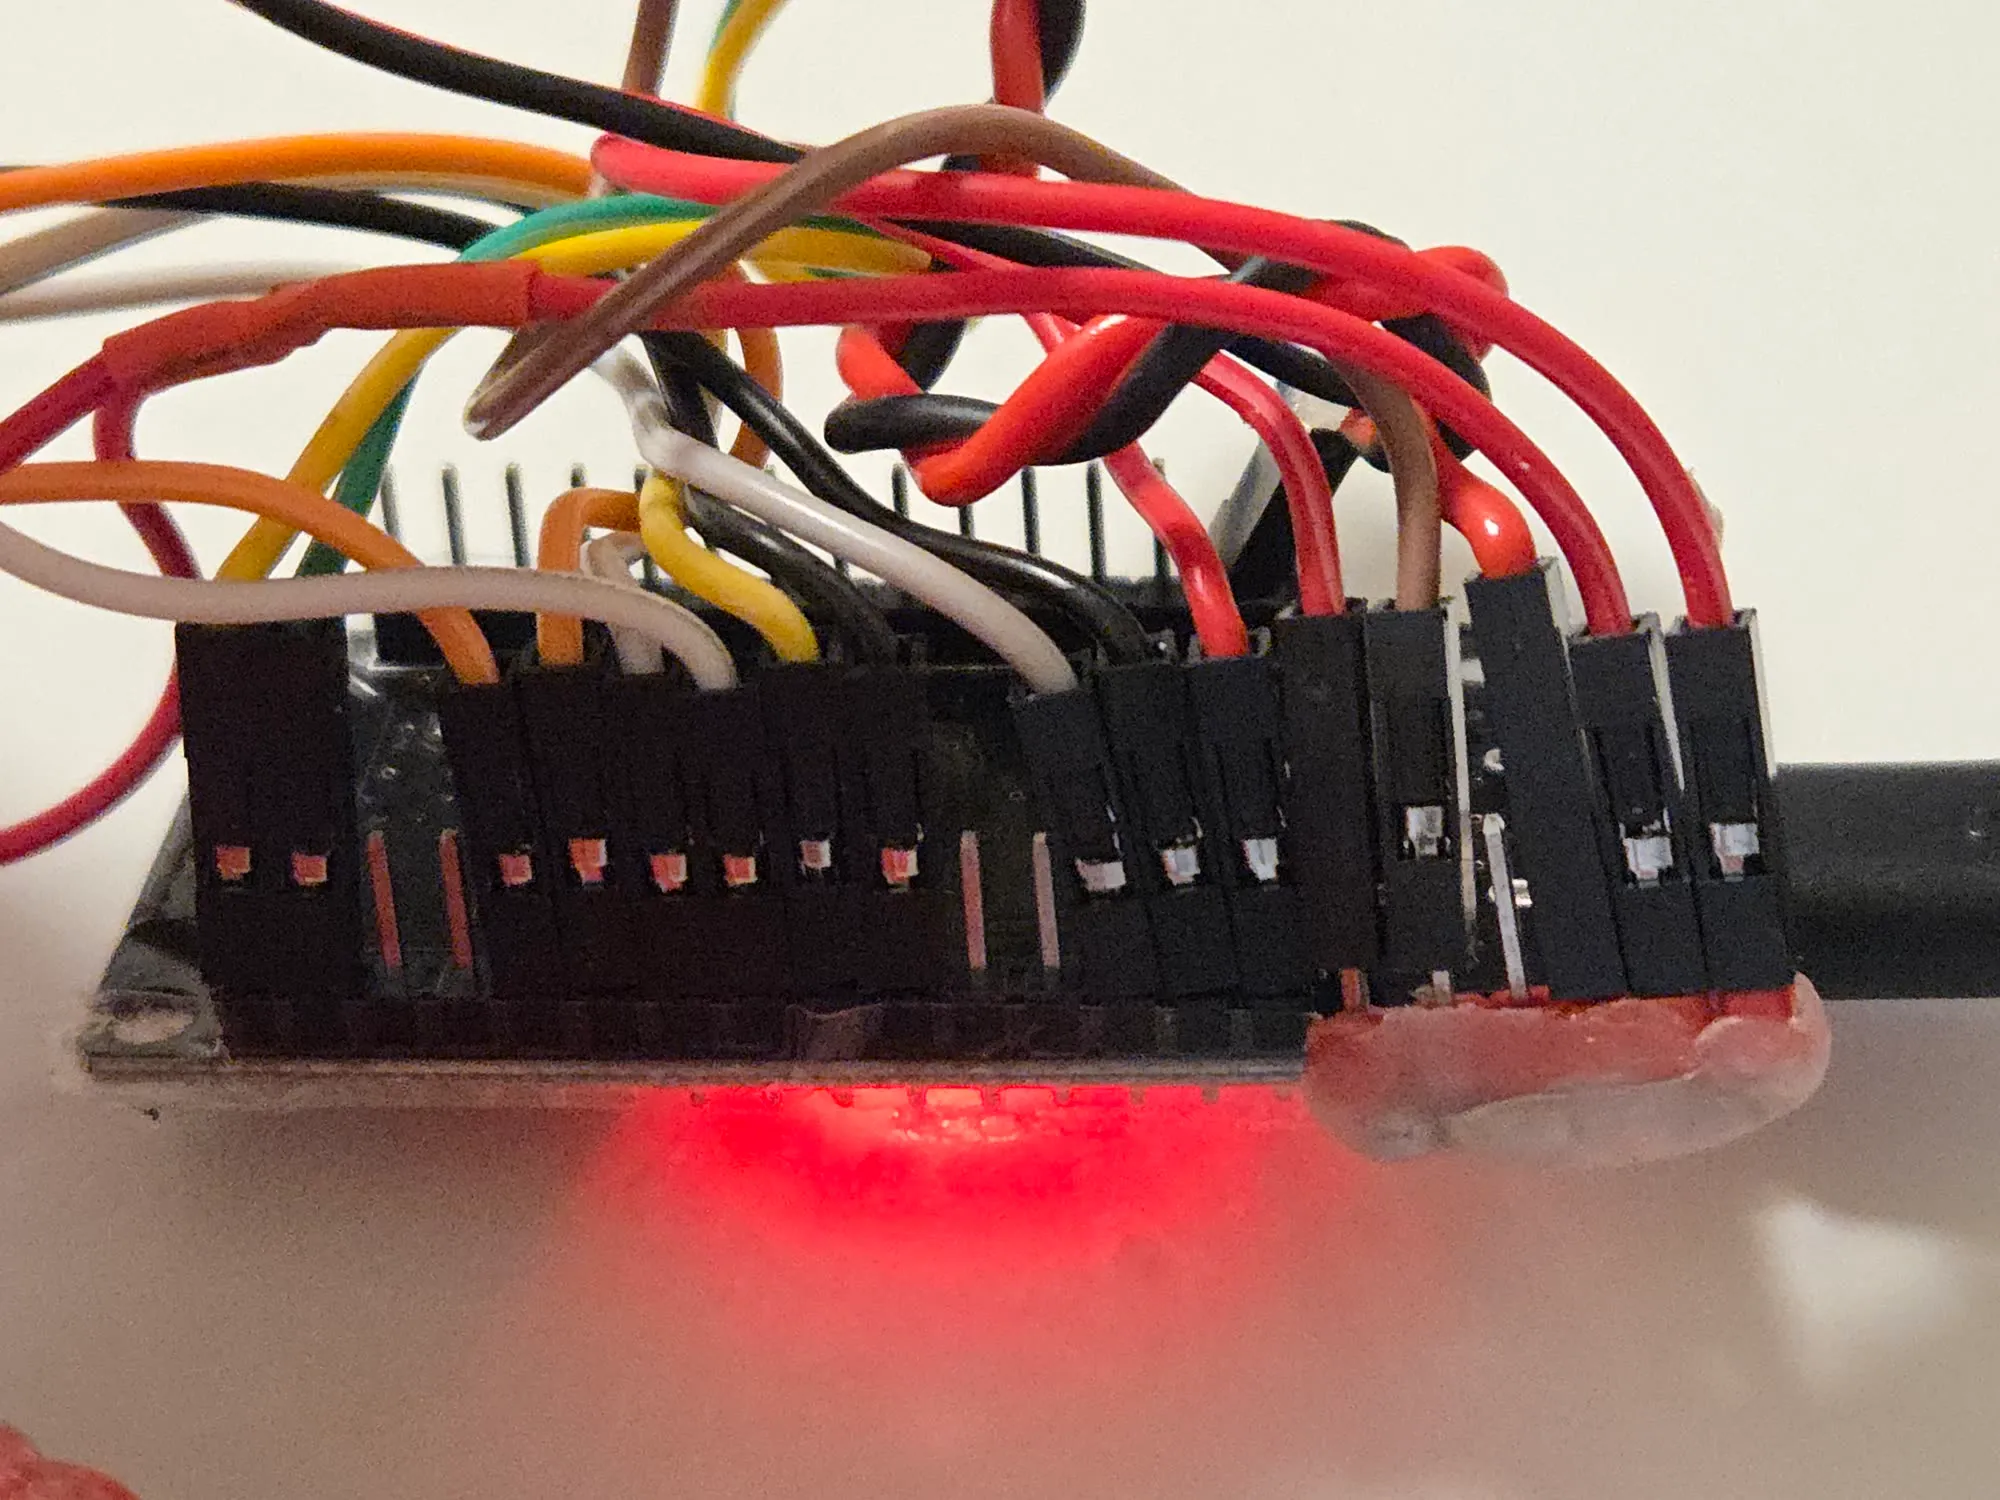
For the Internet of Things project in my first year at NHL Stenden I built a two-node system: the radio controller as a remote, and this device as its screen and a sensor node. It got a second case, designed on 3 December 2025 and revised on 14 January 2026: 81 × 51 mm, 37.5 mm deep against the first case’s 27, with a bezel that screws down over the glass through the four corner holes. Every module connects by jumper leads on header pins and comes out without desoldering.
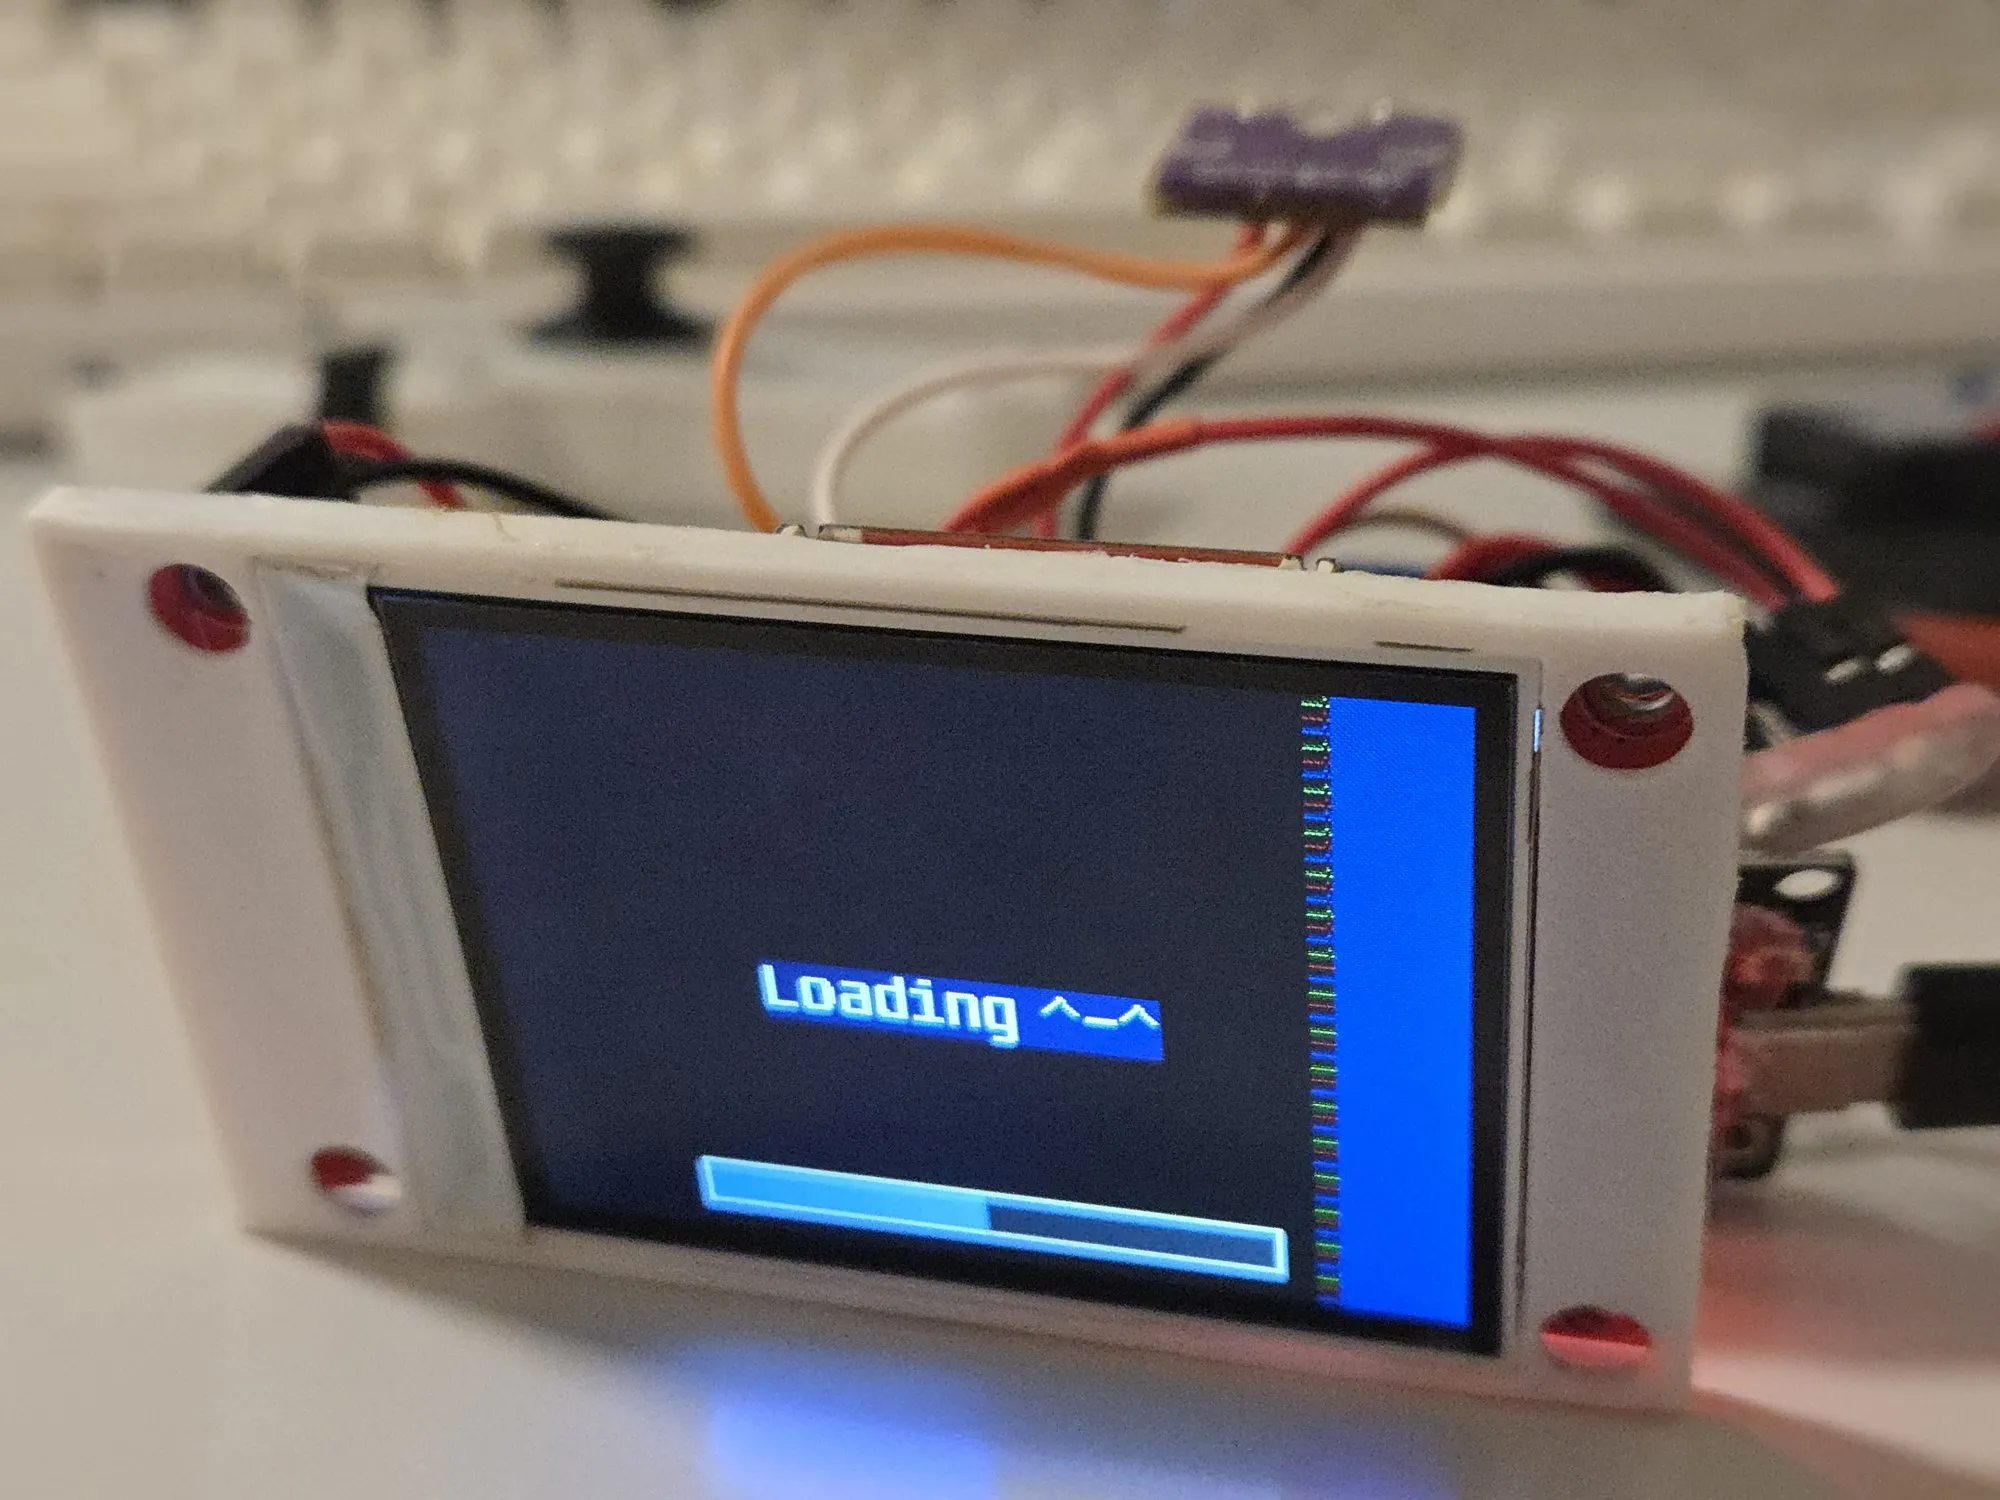
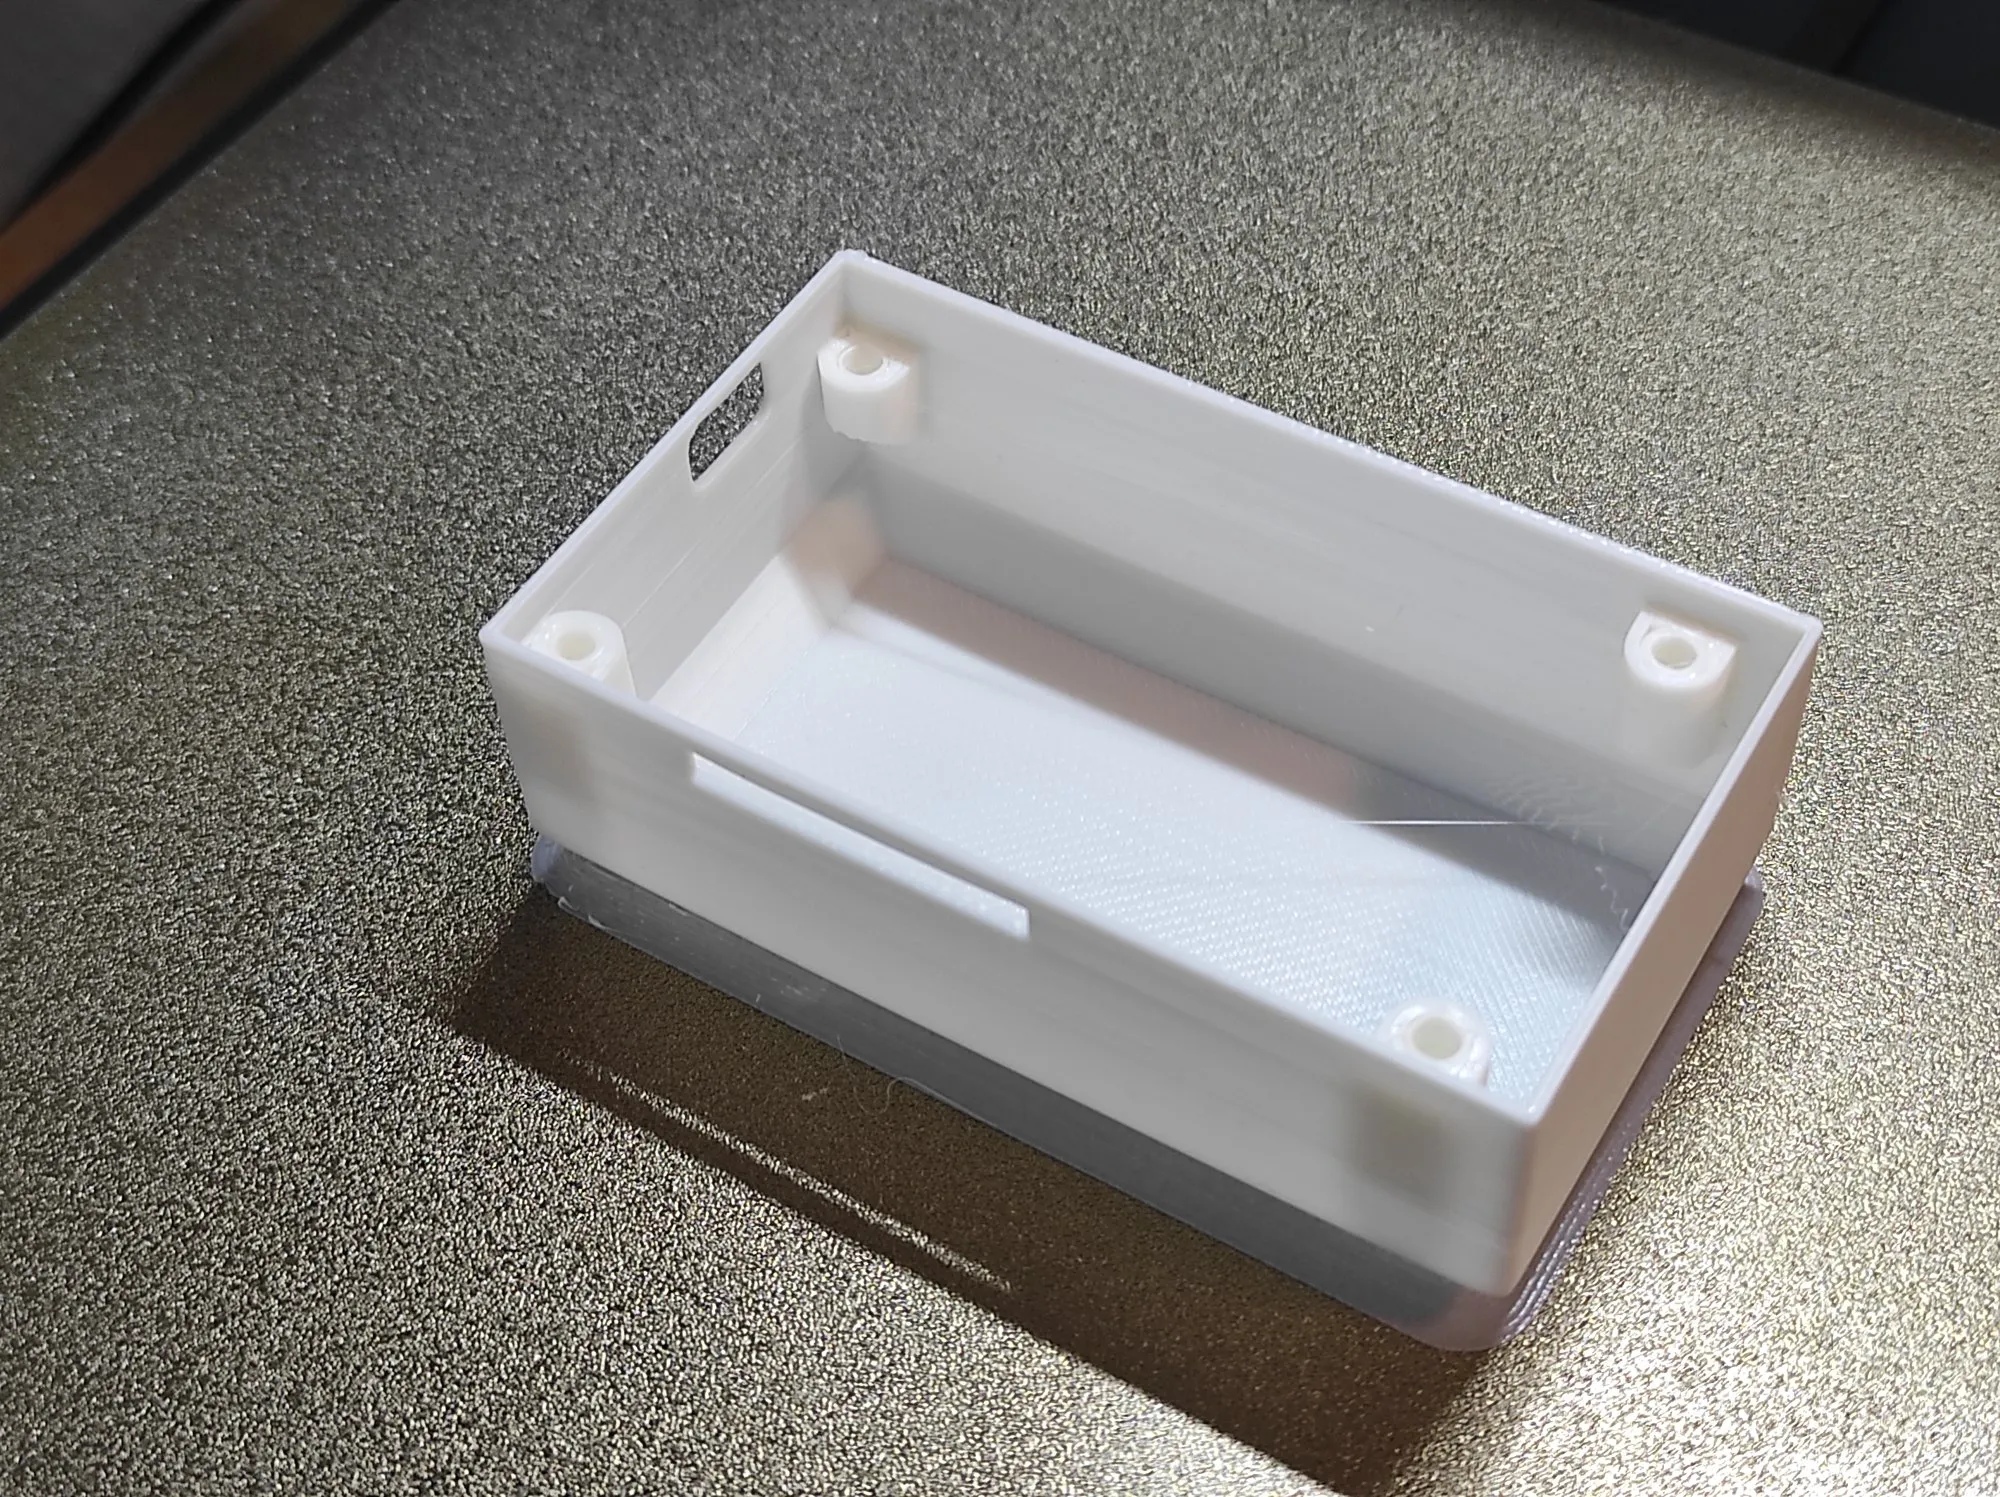
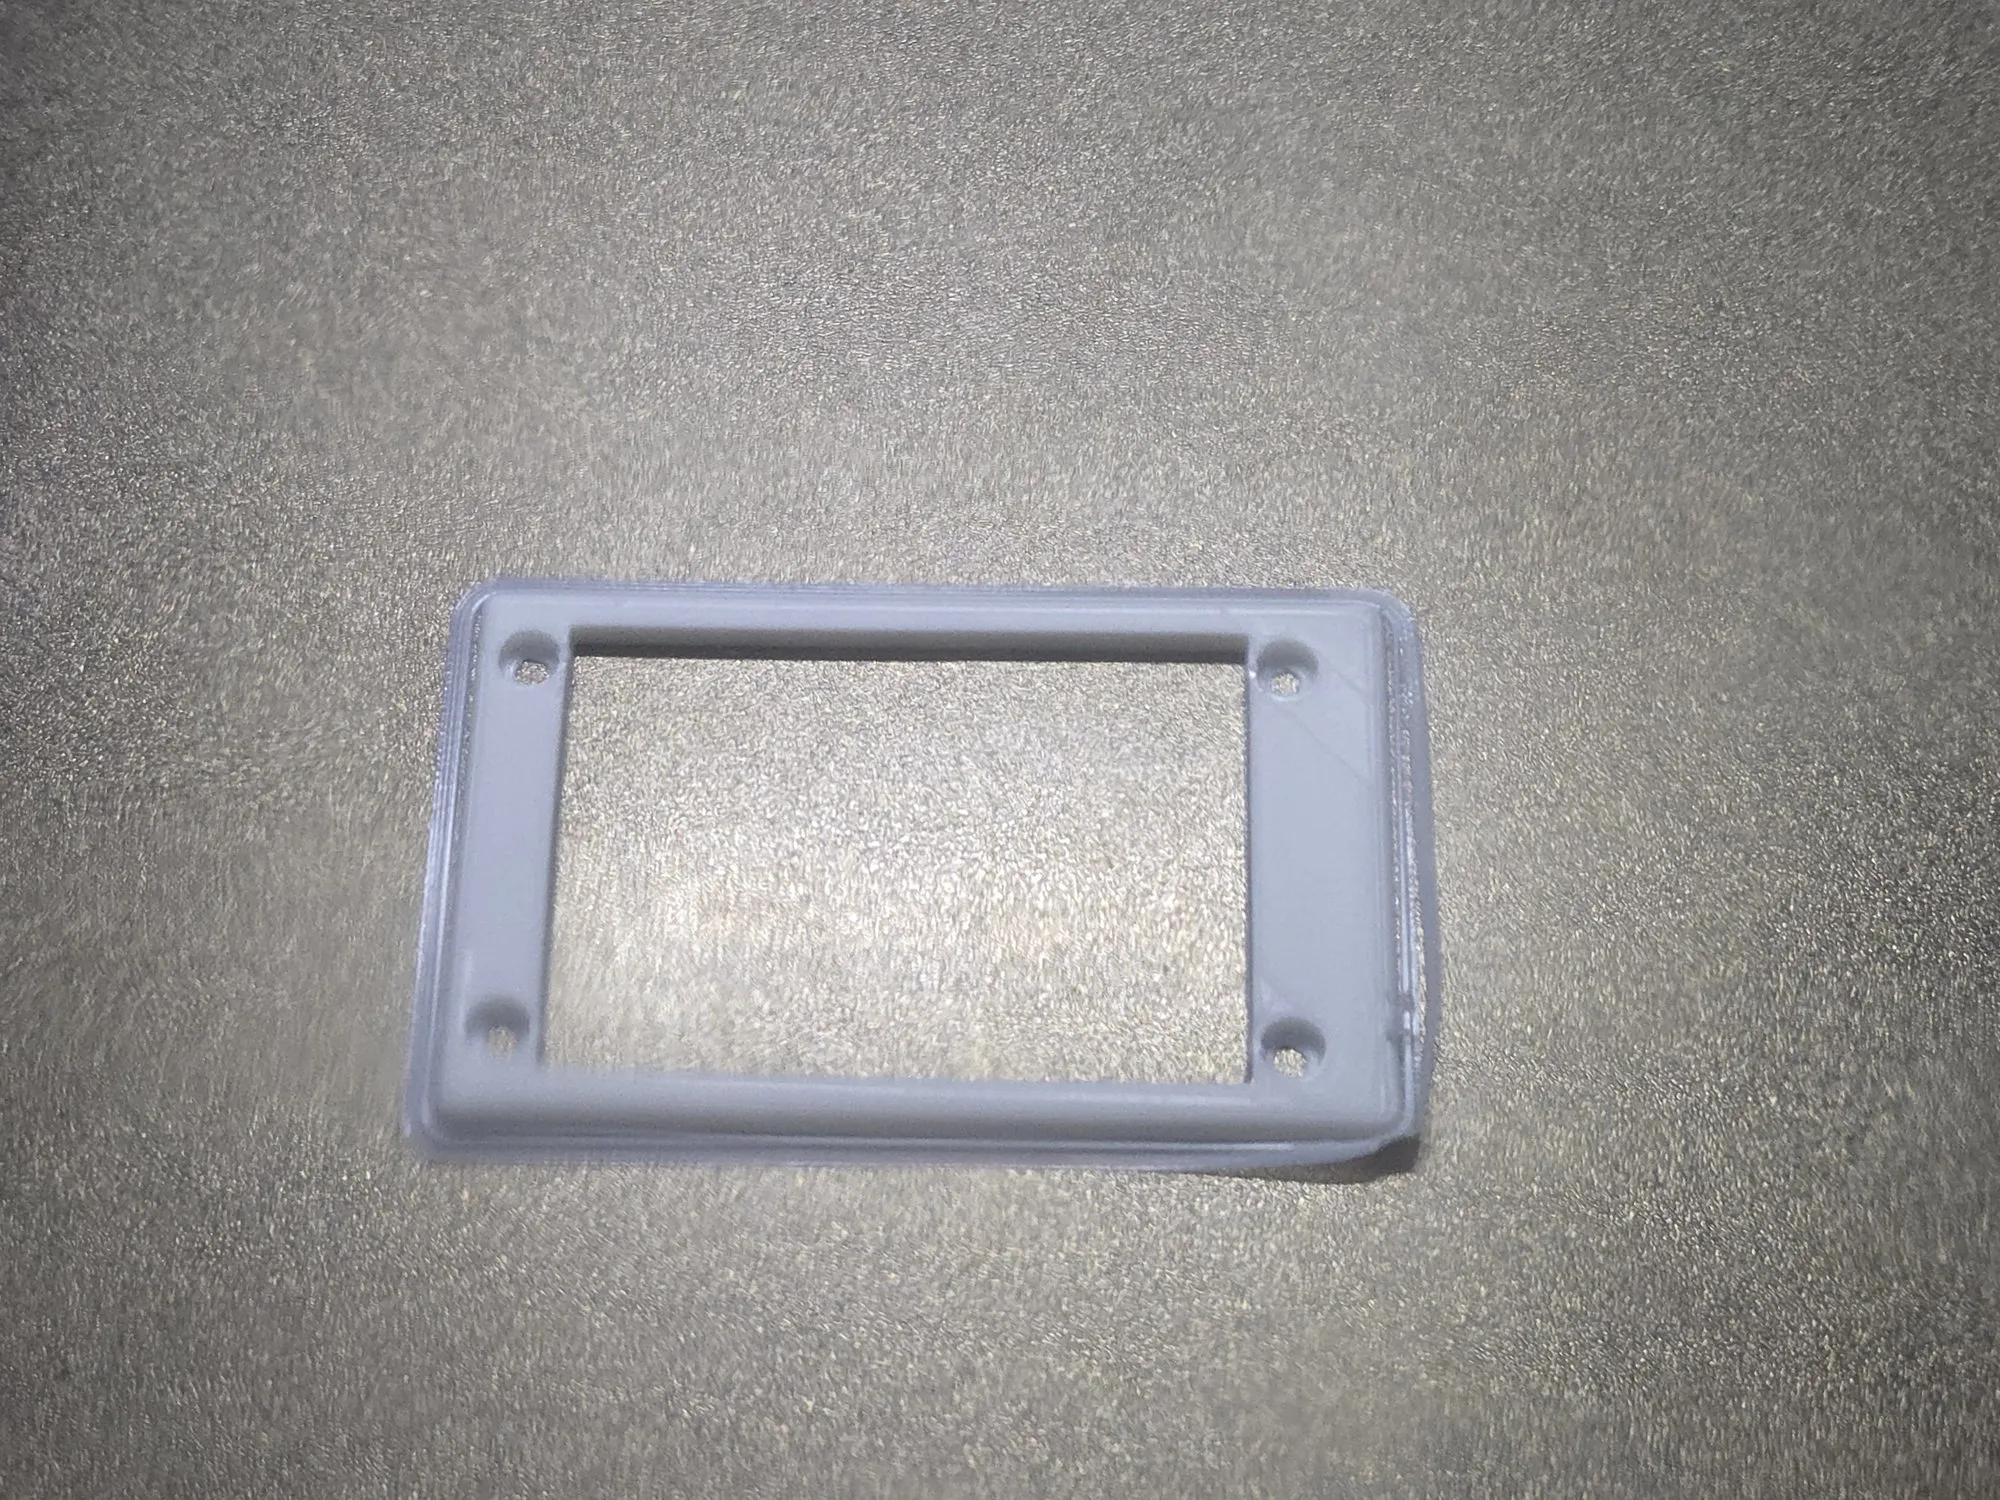
The same night the controller link became an ESP-NOW broadcast carrying a shared tag, so neither side is paired by MAC address. At boot the board listens five seconds for that broadcast. If the controller is transmitting, the panel becomes its remote screen: joystick X and Y, the stick’s click and two buttons, a packet counter, and a dot that follows the stick. Otherwise it joins WiFi and runs the chart loop. When no known network is in range, the scan screen starts a new scan at most once a second and averages each network’s signal over the last three scans; a network missing for three scans drops off, a marker shows whether a network has one, two or three readings behind it, and the list redraws only when it changes or a level moves by more than 2 dBm.
The course required MQTT and non-blocking code, so a separate program on the
same board publishes once a second, timed with ticks_ms instead of a sleep:
temperature, humidity, pressure, both IMU vectors and a touch sensor, each on
its own retained topic under valeriiKozhevets/. It also subscribes. A message
on valeriiKozhevets/buzzer sets a flag, and the main loop, not the callback,
plays a four-note melody (C5, E5, G5, C6) on a PWM buzzer.
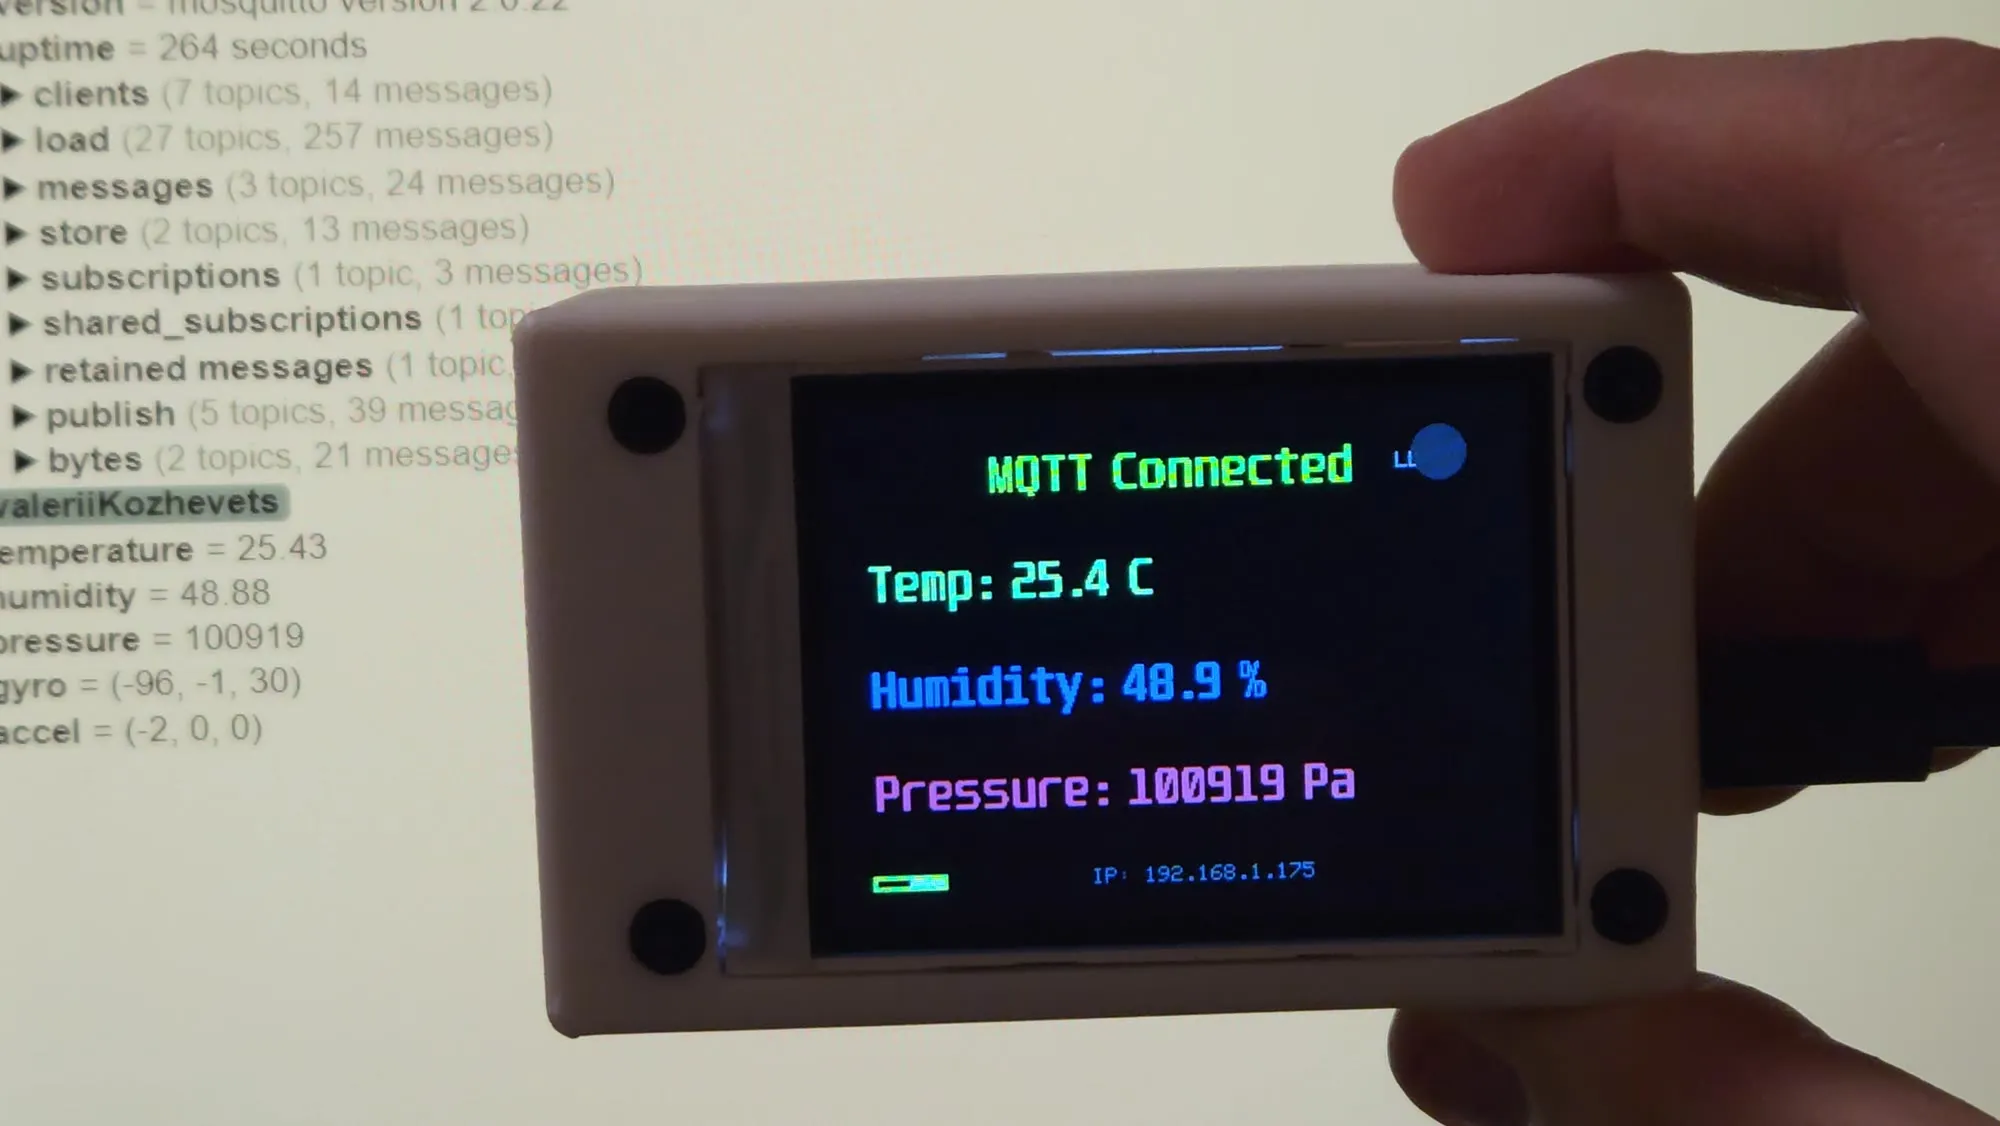
I documented the system with its wiring, activity diagrams and an ethics section on the plain-text ESP-NOW tag, and the project was graded 10.0.