ZSD Alpha Factory
A market-neutral stock-ranking system that dropped its own deep-learning model on the evidence. The surviving engine backtests at Sharpe 0.94 (survivorship-biased) and has paper-traded since June 2026.
| Signal | LightGBM lambdarank on nine price and volume features, ranking the 5-day forward return |
| Validation | expanding walk-forward, retrained every 21 sessions, 5-session embargo |
| Portfolio | CVXPY, dollar- and sector-neutral, beta penalty, 5% daily turnover cap |
| Costs | per-stock half-spread from dollar volume, plus 1.5 bp at the closing auction |
| Backtest | Sharpe 0.94, max drawdown −10.9%, Dec 2017 to Aug 2026, survivorship-biased |
| Paper trading | since 30 June 2026, simulated at closing prices, test orders to Alpaca |
| Code | about 27,000 lines of Python, 318 test functions |
| Stack | Python, LightGBM, CVXPY, PyTorch (the retired deep model), SQLite, PySide6, Windows Task Scheduler |
ZSD Alpha Factory is a market-neutral stock-selection system for 100 large US stocks. Every afternoon a LightGBM model ranks the stocks on their next five days, and a CVXPY optimiser turns the ranking into a book that holds the high-ranked stocks long and the low-ranked short while staying flat in dollars, sectors and market beta. I built it in Python from June 2026. Under its written kill rules I dropped the deep-learning model the project was designed around, and seven later ideas failed on the backtested book. The surviving engine backtests at a Sharpe ratio of 0.94 from December 2017 to August 2026, on a universe biased towards survivors, and has run as a $10,000 simulated paper book since 30 June 2026. No real money is traded.
Forecasting first (February 2025 to June 2026)
I first came at the problem as forecasting. From February 2025 I built neural price-prediction models for stocks (transformer and LSTM encoders, with a Mamba option), desktop apps to train and run them, a backtester with slippage and drawdown breakers, fundamentals scoring and a reinforcement-learning trading environment, the last of it committed on 8 June 2026. In April 2026 I built a first ranking model: a small neural network that scored the S&P 500 stocks on 42 technical features by how each would do against the others over the next 21 trading days, retrained every month in a walk-forward test. This project continued from there.
Kill rules, and the model they killed (8 to 15 June 2026)
The repository starts on 8 June 2026. Five rules in its manifesto veto any model or feature: no look-ahead (point-in-time data and a five-session embargo), no static correlation graphs, no reinforcement learning for position sizing, no Sharpe ratio trusted before it is deflated for the number of trials, and no new signal kept if its rank correlation with future returns (the IC) falls to 0.01 or below once momentum, size, volatility and short-term reversal are regressed out. On 10 June a plain LightGBM ranker on nine price and volume indicators set the bar any more complex model had to beat: a mean IC of 0.019 over 102 walk-forward splits, positive in 65% of them.
The model the project was designed around was a Mamba state-space model with a graph attention layer across the stocks. On the 8 GB RTX 3070 an epoch first took about 22 minutes, because the selective scan ran as a 256-step Python loop and the data panel was rebuilt for every split. I replaced the loop with a parallel associative scan with a hand-written backward pass, kept the normalised panel on the GPU and halved the inner width to fit memory, which brought an epoch to 35 to 70 seconds. Two more fixes stopped the model collapsing to a constant output: the ranking loss had been blind to the scale of the scores, and the graph layer had no residual connection.
The first version of the factor audit regressed the scores on the model’s own inputs, which proves nothing, so I rebuilt it on external factors (12-1 momentum, size, 63-day volatility, 21-day reversal). On that audit the mean residual IC over twelve splits was −0.0084, and the raw IC of 0.0095 was half the LightGBM bar. I dropped the model on 14 June and kept LightGBM. A Kolmogorov-Arnold network was dropped the next day: as a forecaster of market volatility it lost to ridge regression out of sample, IC 0.50 against 0.54. Aware Intelligence works the same way, with its kill criteria fixed before the results come in.
An optimiser for a thin signal (15 and 16 June)
Every score is out of sample in time: the ranker trains on an expanding window, retrains every 21 sessions and leaves a five-session gap before the dates it scores. Traded as a plain top-fifth against bottom-fifth portfolio, an IC of 0.019 earned a Sharpe of 0.09 after 5 bp costs, because the book turned over 58% a day.
The CVXPY optimiser changed that. Each day it maximises expected alpha minus Ledoit-Wolf risk and trading cost, holds the book dollar- and sector-neutral, penalises market beta, limits any one stock to 10% and caps turnover at 5% of the book a day. On the same scores the first version, at 20% turnover, reached a Sharpe of 0.83; at 5% it reached 1.11.
The deflated Sharpe of that sweep, a probability with 0.95 as the pass line, first came out at 0.937 over a 27-cell grid, but each of the nine weight configurations appeared three times, at three cost levels. Counted as the nine trials of that sweep, it passes at costs up to 10 bp, and the nine are 0.89 correlated: about 1.2 independent strategies, which makes this one strategy with small variations.
After that, only risk changes helped. Sector neutrality left the Sharpe where it was, so the edge does not come from sector bets. The book was dollar-neutral on paper and still carried a market beta of 0.29. A hard beta constraint was infeasible on about 73% of days, so beta became a penalty in the objective, which held it at 0.012 and cut the worst drawdown from −18% to −10.9% at the same Sharpe. The two alpha additions tested on 16 June did not help: path-signature features raised the IC by 0.004 without improving the book, and tilting the daily scores towards fundamentals from SEC filings, which predict only over about 63 days, took the Sharpe from 1.11 to 0.62.
For costs I first built the Abdi-Ranaldo spread estimator from daily highs and lows and rejected it: it ranked NVIDIA’s spread wider than Ford’s, tracking volatility rather than liquidity. The model now charges each stock a half-spread derived from its dollar volume, 1.4 to 2.7 bp on these stocks. Widening the universe to 462 S&P 500 stocks added about 3.5 points of annual return and no Sharpe. I closed the research phase on 16 June 2026.
The backtest, re-measured (17 June to 2 September)
On 17 June I built a PySide6 simulator that replays the engine day by day. Rebuilding its scores from a fresh download of the price history took the Sharpe from about 1.1 to 0.90, because the research score caches had been made on an earlier download. Every score cache now carries a fingerprint of the data it came from and is regenerated when that changes. The same day a 1.5 bp charge for the closing auction took the figure to 0.88. The live book decides on one day’s closing prices and fills at the next day’s close; on 7 July I measured what that one-session delay costs: 0.03 of Sharpe.
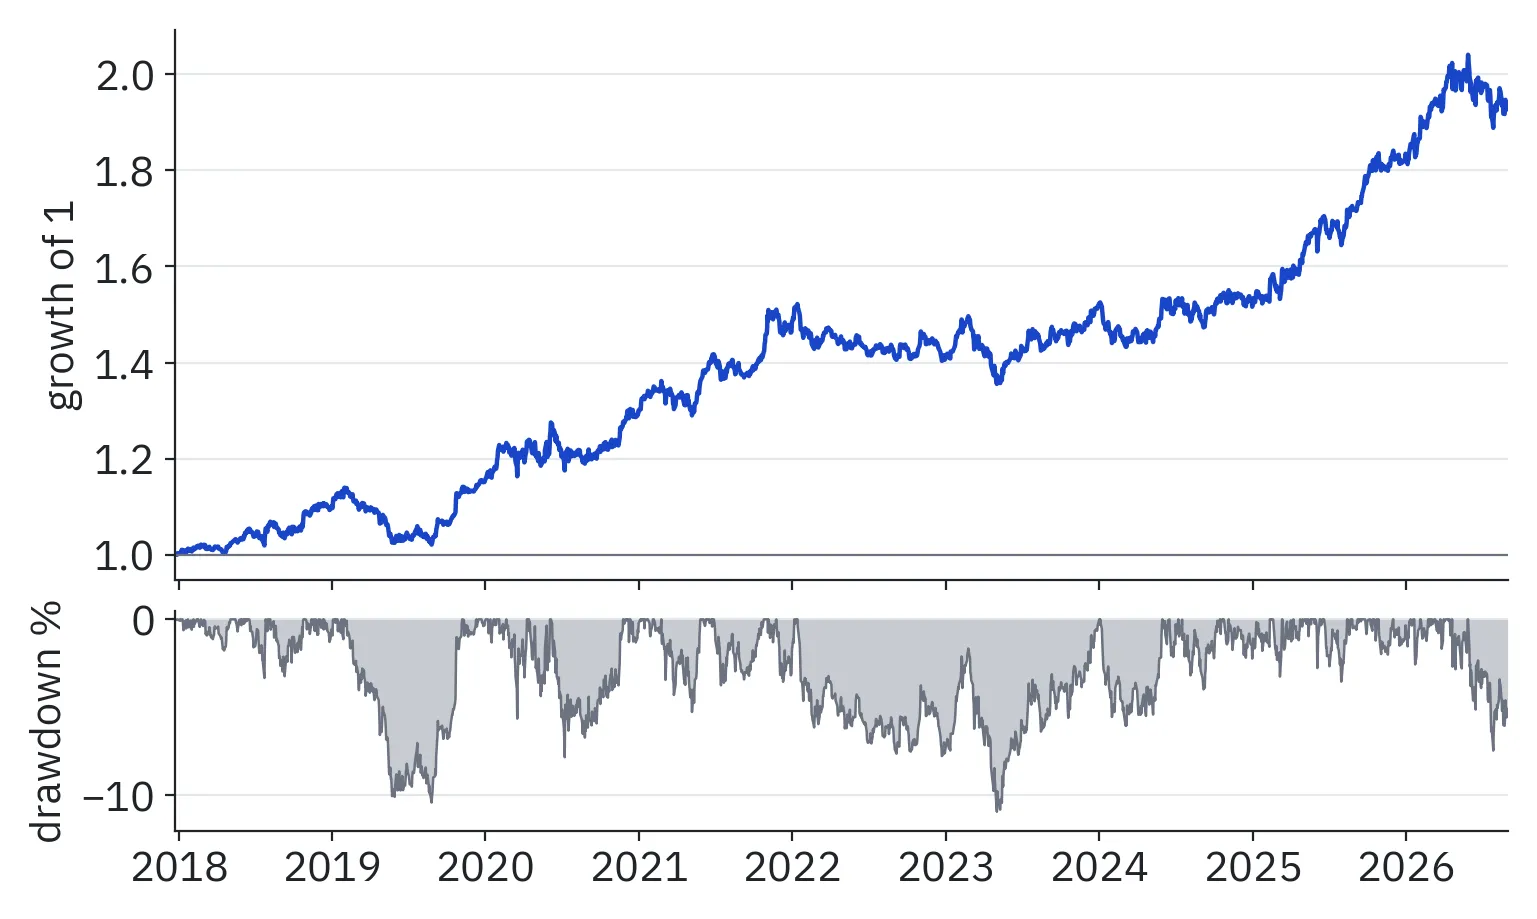
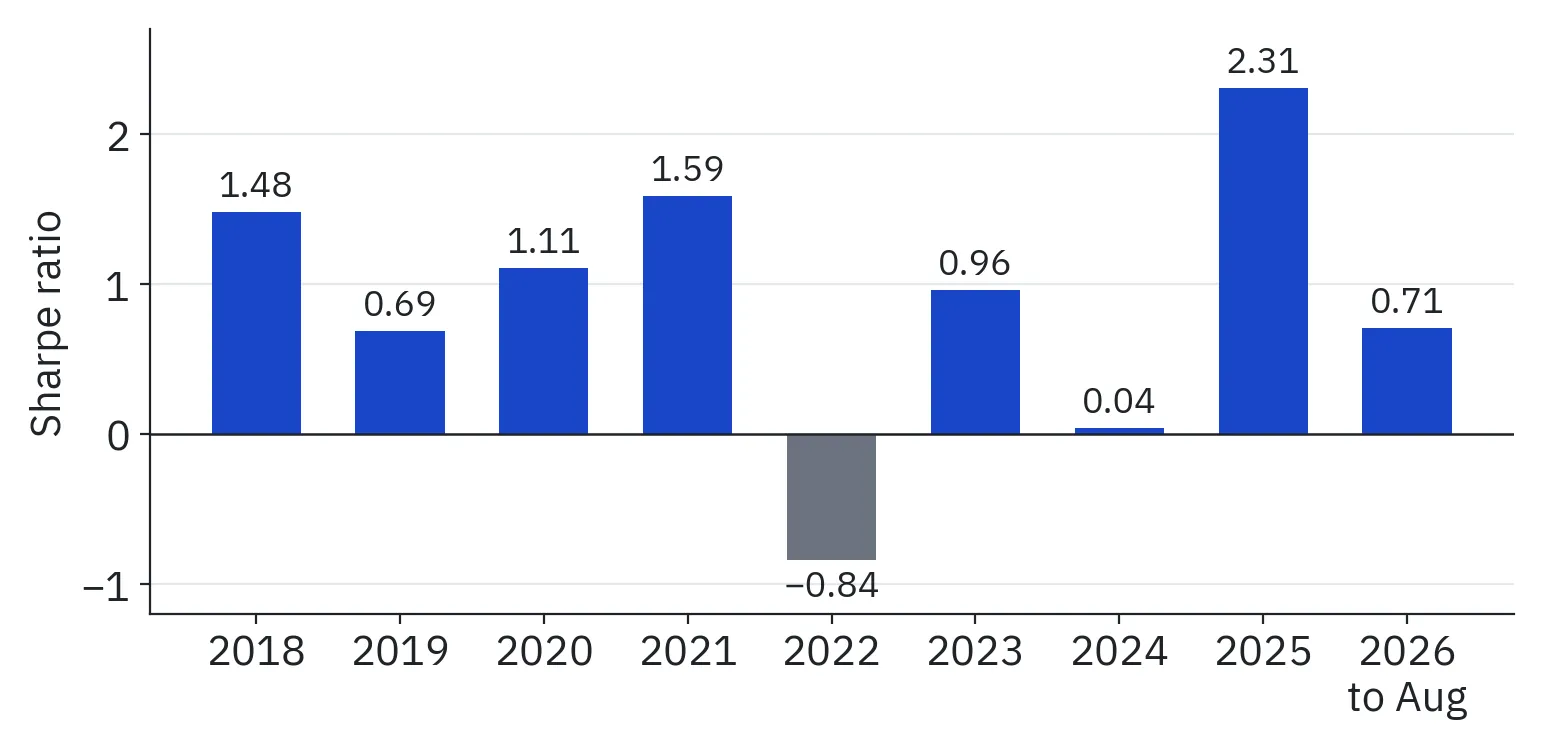
The current reference is a full rerun of the engine on 2 September 2026, on data to the end of August: Sharpe 0.94, 7.9% a year at 8.5% volatility, maximum drawdown −10.9%, about 14 stocks long and 15 short. It fills at the decision’s own close, so the live delay would take roughly 0.03 off. The universe is a fixed list of 100 large stocks from today’s S&P 500 applied backwards, so companies that shrank or were delisted are missing.
Ideas that failed on the portfolio (16 June to 2 September)
Each idea ran through the CVXPY optimiser with trading costs and was compared with the baseline of its own test.
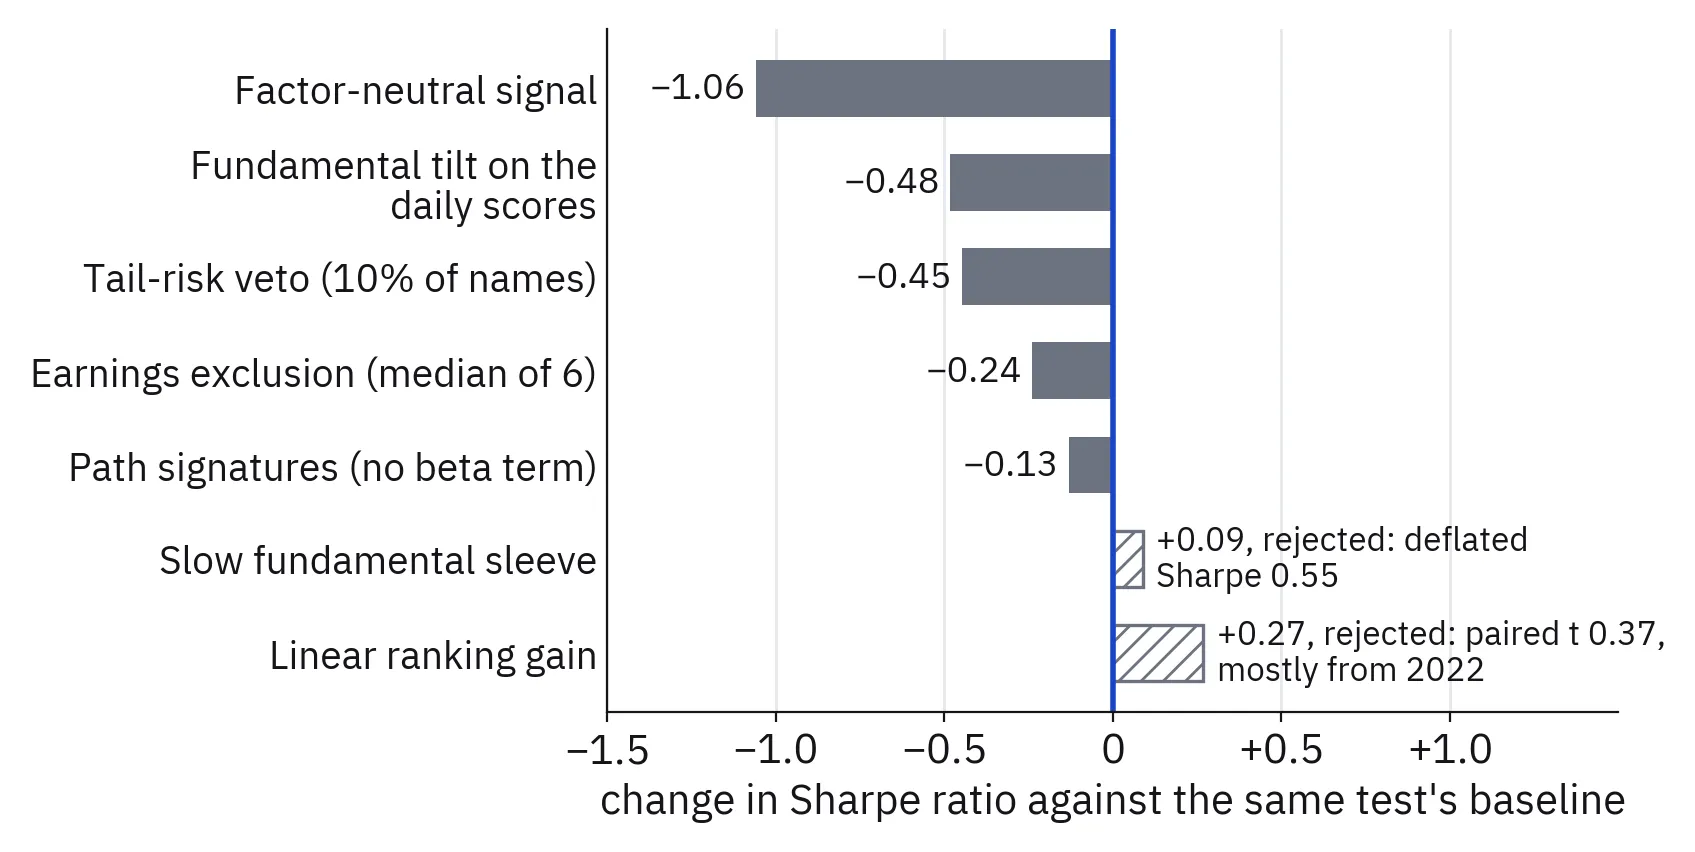
The largest drop came on 23 June, and it shows what the edge is made of. The ranker’s own residual IC is about 0.002, under the 0.01 line the Mamba model was dropped for, and removing momentum, size, reversal and volatility from its scores before they reach the optimiser takes the Sharpe from 0.88 to −0.18. The ranker is paid for its exposure to known price characteristics, which the optimiser turns into a hedged book. The same day, a slow fundamental sleeve looked like a diversifier, adding 0.09 Sharpe and roughly halving the drawdown, until its deflated Sharpe over the 20 variants searched came out at 0.55.
On 30 June two risk filters failed. Vetoing the most volatile tenth of the stocks took the Sharpe from 0.93 to 0.48, because it removes the stocks carrying the alpha. Excluding stocks around their quarterly filings roughly doubled turnover and lowered the Sharpe in five of six variants.
On 2 September I tested the ranking loss itself. LightGBM’s default gain in lambdarank weights the top of the list exponentially, and the deployed model’s ranking inside the bottom half, the half the book shorts, had an IC of only 0.0014. A linear gain raised that to 0.0050 and the book’s Sharpe by 0.27, but year by year the gain was positive in only four of nine years and came mostly from 2022 (paired t 0.37), so production kept the default.
My working hypothesis is that the survivor-only universe is the ceiling, since the short side is missing the stocks that failed. Testing it needs paid data that includes delisted stocks. One lead is still open: the ranker predicts the overnight move (close to next open) better than the whole day, IC 0.022 against 0.018, and a model trained on the overnight move keeps a residual IC of 0.011 after a nonlinear double machine learning check against the known factors (t 4.45). Trading it needs a separate close-to-open engine.
Paper trading since 30 June 2026
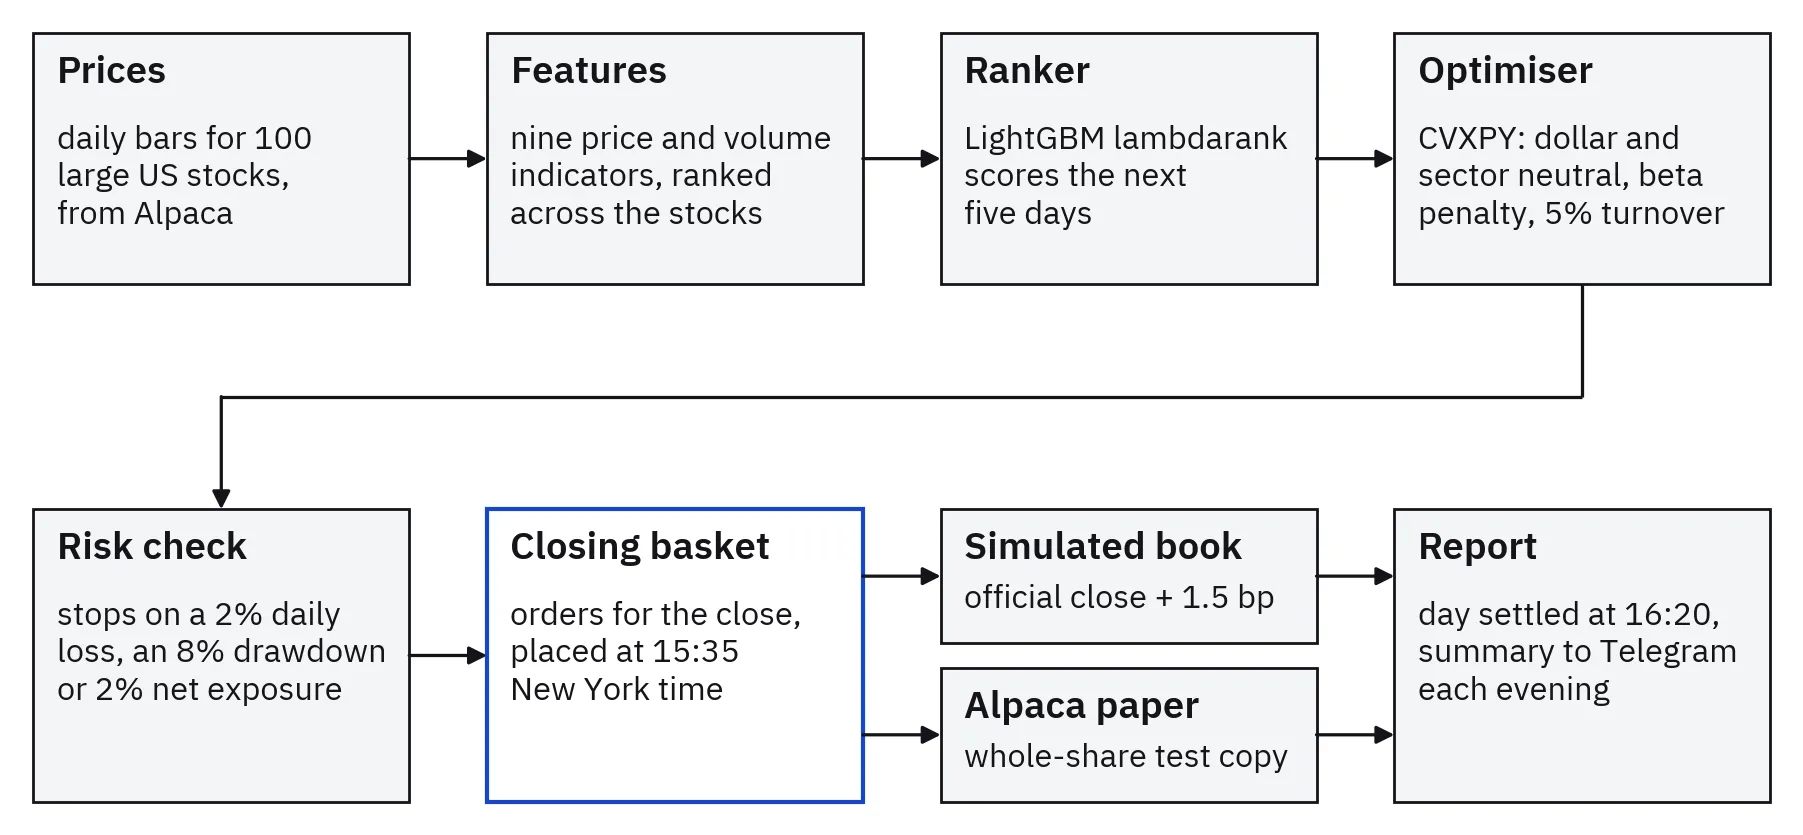
The Alpaca paper account and the Telegram alerts were connected on 24 June. The first scheduled submission, in that day’s session, was stopped by the data-freshness gate: Yahoo’s prices were a day behind, so the daily data now comes from Alpaca. Alpaca’s paper account simulates the closing auction poorly, filling a few shares of an order and expiring the rest, so from 29 June the book of record is a simulated book filled at the official closing price plus 1.5 bp, and a whole-share copy of each basket still goes to Alpaca to test the order path. The book restarted at $10,000 on 30 June.
Windows Task Scheduler places the orders at 15:35 New York time, with two watchdog retries before the 15:50 auction cutoff, and settles the day at 16:20. A risk monitor polls every five minutes and a report goes to Telegram each evening. The breakers halt on a 2% daily loss, an 8% drawdown or a target net exposure beyond 2%.
Running it daily found bugs no backtest can. Five came from checks timed on the wrong clock: wall-clock hours where the market runs on trading sessions, or raw sample counts where the statistics need an effective sample size. The worst, on 29 July 2026, was the daily-loss breaker reading a two-session move as one day because a mark was missing; it flattened the book, and the limit now scales with the square root of the sessions it spans. Each of the five has a regression test file named after its date. Between 5 and 24 August, 6 of 14 scheduled submissions never ran: one ran out of memory, one fell inside a window in which my own maintenance script had disabled the tasks, and four left no trace in the logs. After a watchdog and a memory reclaim step went in on 24 August, all eight sessions from 1 to 11 September ran.
An audit on 2 September found that the flatten call would have raised on the broker’s real response format, a path no simulated drill had touched. On 5 September I drilled the fixed kill switch against the broker API with the market closed: 21 liquidating orders accepted in 0.4 seconds, then cancelled before the open. The drill also showed that a kill fired in the 16:20 settlement only queues orders for the next open, so the loss and drawdown decision now runs in the submit step, before the basket is armed, while a market order still fills.